-
Gold rises amid renewed EU-US trade tensions, as hopes for a trade deal diminish.
-
The US Dollar softens, prompting investors to turn to safe-haven assets like bullion.
-
XAU/USD challenges symmetrical triangle resistance, signaling a possible breakout ahead.
Gold (XAU/USD) advances on Monday as escalating trade tensions between the European Union (EU) and the United States (US) renew demand for the safe-haven metal. With the August 1 tariff deadline fast approaching and limited progress in negotiations, investors are turning to Gold as a hedge against uncertainty.
Discussions between the US and EU have stalled in recent weeks, with US President Donald Trump threatening to impose a 30% tariff on most goods imported from the EU in a bid to shrink the trade deficit. At the time of writing, XAU/USD has rebounded to trade above $3,370, reflecting heightened risk aversion.
Over the weekend, US Commerce Secretary Howard Lutnick expressed cautious optimism in an interview with CBS News, stating, “These are the two biggest trading partners in the world, talking to each other. We’ll get a deal done.” However, he reaffirmed that no extensions would be granted, saying, “That’s a hard deadline, so on August 1, the new tariff rates will come in.”
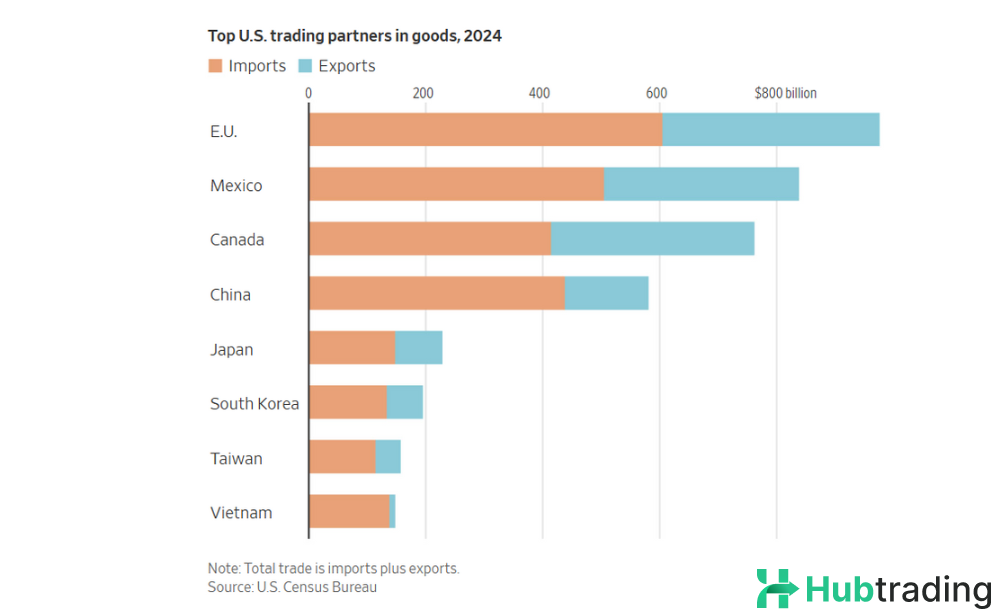
According to CNBC, the European Council reported that total trade between the EU and US reached $1.96 trillion in 2024—underscoring the high stakes of a breakdown in negotiations.
Even if a limited agreement is reached, the US has signaled that the EU would still face a baseline tariff of 15% to 20%. In preparation for a worst-case scenario, the EU has warned it will retaliate if no deal is finalized. The rising trade tensions are weighing on the US Dollar, as multiple countries find themselves entangled in similar disputes. A softer USD enhances Gold’s appeal, making it more affordable for foreign investors and strengthening its role as a store of value in times of economic uncertainty.
Daily Digest Market Movers: Gold Gains on Trade Tensions and Tariff Pressure
- Gold (XAU/USD) continues to react to mounting global trade tensions, as concerns intensify over the far-reaching impact of US-imposed sector-specific tariffs. While overall economic data from the US remains strong, uncertainty around trade policy and inflation expectations is supporting demand for the non-yielding precious metal.
- Ongoing trade friction between the US and its global partners is taking center stage. Sector-specific tariffs remain firmly in place, including a 50% tariff on steel and aluminum, with copper imports set to face the same rate starting next month. Additionally, auto parts imported into the US are already subject to a 25% levy, and President Trump has hinted at upcoming tariffs on pharmaceuticals and semiconductors.
- According to Bloomberg, estimates from the European Union indicate that nearly 70% of exports to the US are currently subject to duties, impacting roughly $442 billion in trade. Despite these pressures, recent US economic data suggests resilience. Friday’s Michigan Sentiment report showed continued consumer optimism, while the University of Michigan’s inflation expectations survey revealed declining forecasts for both 1-year and 5-year periods.
- US Retail Sales released on Thursday also beat expectations, reflecting strong consumer spending and reinforcing the Federal Reserve’s cautious stance. The Fed remains hesitant to cut interest rates amid concerns that tariffs could drive prices higher. As of now, markets are pricing in a 57.8% chance of a rate cut at the September FOMC meeting, while the probability of rates holding steady stands at 39.5%, according to the CME FedWatch Tool. Shifts in these odds will directly impact US Treasury yields and, by extension, the demand for Gold.
Gold Technical Outlook: XAU/USD Eyes Breakout From Triangle Pattern
From a technical standpoint, Gold remains in a consolidation phase, trading within a symmetrical triangle pattern on the daily chart. This suggests the potential for a sharp directional move. XAU/USD is currently testing triangle resistance near the 23.6% Fibonacci retracement level of the April rally, around $3,372. A firm break above this level could trigger bullish momentum toward the psychological $3,400 mark, with the June 16 high at $3,452 as the next major target. A further rally could open the path to retest the all-time high near $3,500.
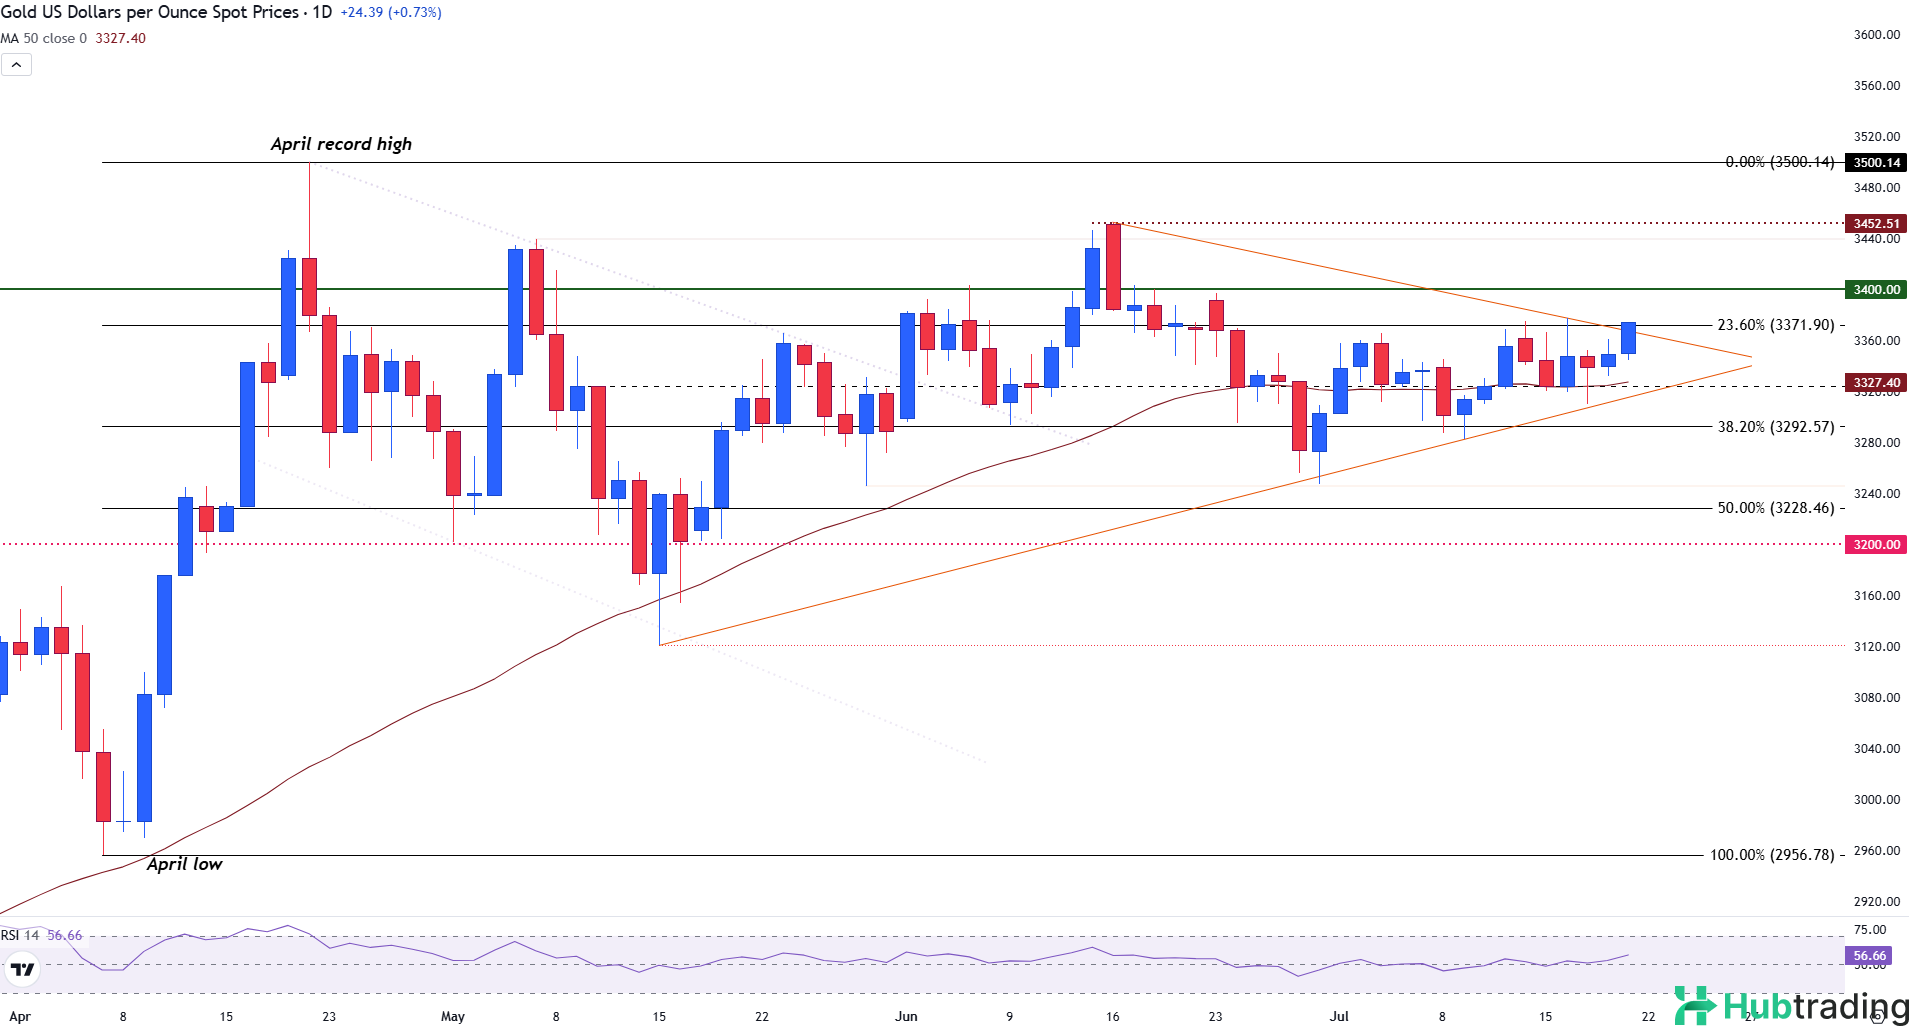
On the downside, immediate support is seen at the $3,350 psychological level, followed by the 50-day Simple Moving Average (SMA) at $3,327. The 38.2% and 50% Fibonacci retracement levels at $3,392 and $3,328, respectively, may offer strong support if a pullback occurs.
The Relative Strength Index (RSI) currently stands at 56, suggesting a mild bullish bias without reaching overbought conditions. Overall, the technical and fundamental landscape points to a potential breakout, with traders closely watching for confirmation of the next move.


