-
AUD/USD rises 0.36% to 0.6519, rebounding from a session low of 0.6488.
-
US July Retail Sales increase 0.5% MoM, largely reflecting higher prices rather than stronger consumer demand.
-
University of Michigan Consumer Sentiment dips to 58.6, with inflation expectations climbing to 4.9% (1-year) and 3.9% (5-year).
The AUD/USD pair advances on Friday during the North American session, trading at 0.6519 after rebounding from a daily low of 0.6488. The move comes as the US Dollar trims gains from Thursday’s post-PPI rally, even as solid US Retail Sales suggest the economy remains resilient.
Aussie rebounds as weaker US sentiment tempers retail strength
US July Retail Sales rose 0.5% MoM, in line with expectations, following an upward revision to June’s data at 0.9%. However, the increase was largely attributed to rising prices rather than higher consumption volumes.
Meanwhile, the University of Michigan’s preliminary Consumer Sentiment Index for August dropped to 58.6 from July’s 61.7, missing forecasts for a rise to 62.0. Survey director Joanne Hsu noted that the decline was primarily driven by growing concerns about inflation. Inflation expectations jumped, with the 1-year outlook rising from 4.5% to 4.9%, and the 5-year projection climbing from 3.4% to 3.9%.
The US Dollar Index (DXY) drops 0.44% to 97.76, providing support for the Australian Dollar.
Last week, the Reserve Bank of Australia (RBA) delivered a widely expected 25 basis-point cut, bringing the cash rate to 3.6%. Improved labor market data suggests a gradual recovery. UBS analysts maintain a cautious easing view, anticipating two additional 25 bps cuts in November and February, with a projected terminal rate of 3.1%. They reaffirm their AUD/USD forecast at 0.68–0.70 by mid-2026.
Looking ahead, next week’s calendar is relatively light, though global flash PMIs and Fed Chair Jerome Powell’s speech at Jackson Hole will be closely watched for signals on future US interest rate moves.
AUD/USD Technical Outlook
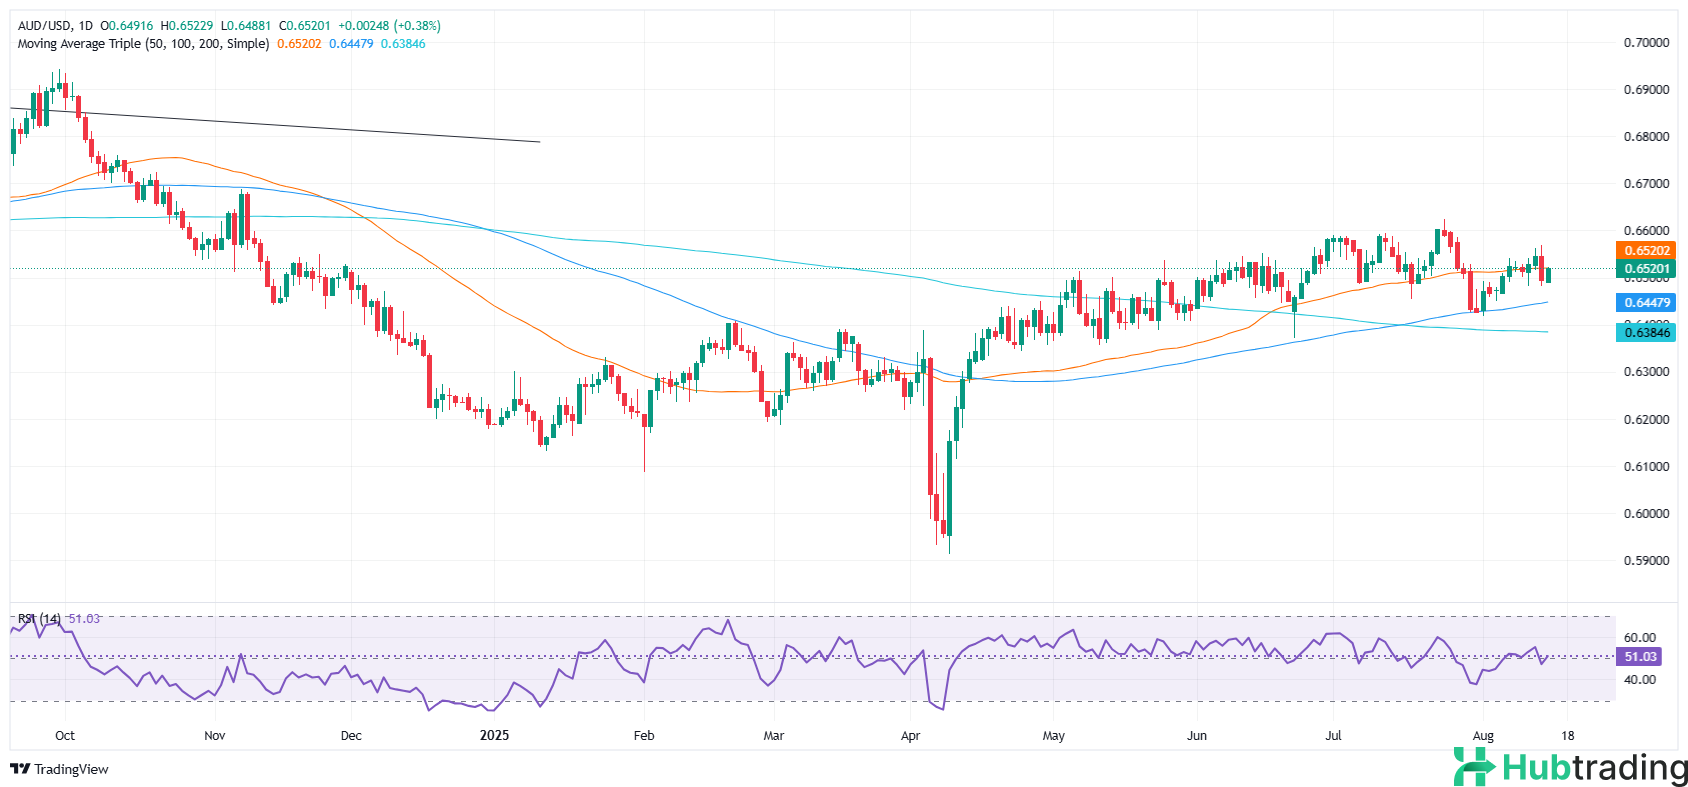
After recovering in late July, AUD/USD topped near 0.6567 and is now testing resistance at the 50-day Simple Moving Average (SMA) around 0.6520. Immediate support lies at the 20-day SMA near 0.6514. A break below could expose the 0.6500 level, with stronger support seen at the 100-day SMA at 0.6448.
On the upside, a sustained move above 0.6520 would bring the weekly high of 0.6567 into focus, followed by the psychological 0.6600 resistance level.


