- AUD/USD sees some dip-buyers on Monday, but the uptick lacks strong bullish conviction.
- The technical setup suggests caution before considering any further upward movement.
- Bearish traders should wait for a break below the 50% Fibonacci level before entering new positions.
The AUD/USD pair starts the new week on a positive note, breaking a two-day losing streak and halting its recent pullback from the highest level since February 2023 reached last Monday. Spot prices are currently trading just above the 0.6800 mark, up 0.20% for the day, although there is a lack of follow-through buying amid a bullish US Dollar (USD).
The encouraging US monthly employment data released on Friday alleviated concerns about an economic slowdown, while optimism regarding China's stimulus continues to support a risk-on sentiment. Additionally, the Reserve Bank of Australia's (RBA) hawkish stance benefits the risk-sensitive Australian dollar. However, diminishing expectations for aggressive policy easing by the Federal Reserve (Fed) and escalating geopolitical tensions in the Middle East bolster the safe-haven USD, creating headwinds for the AUD/USD pair.
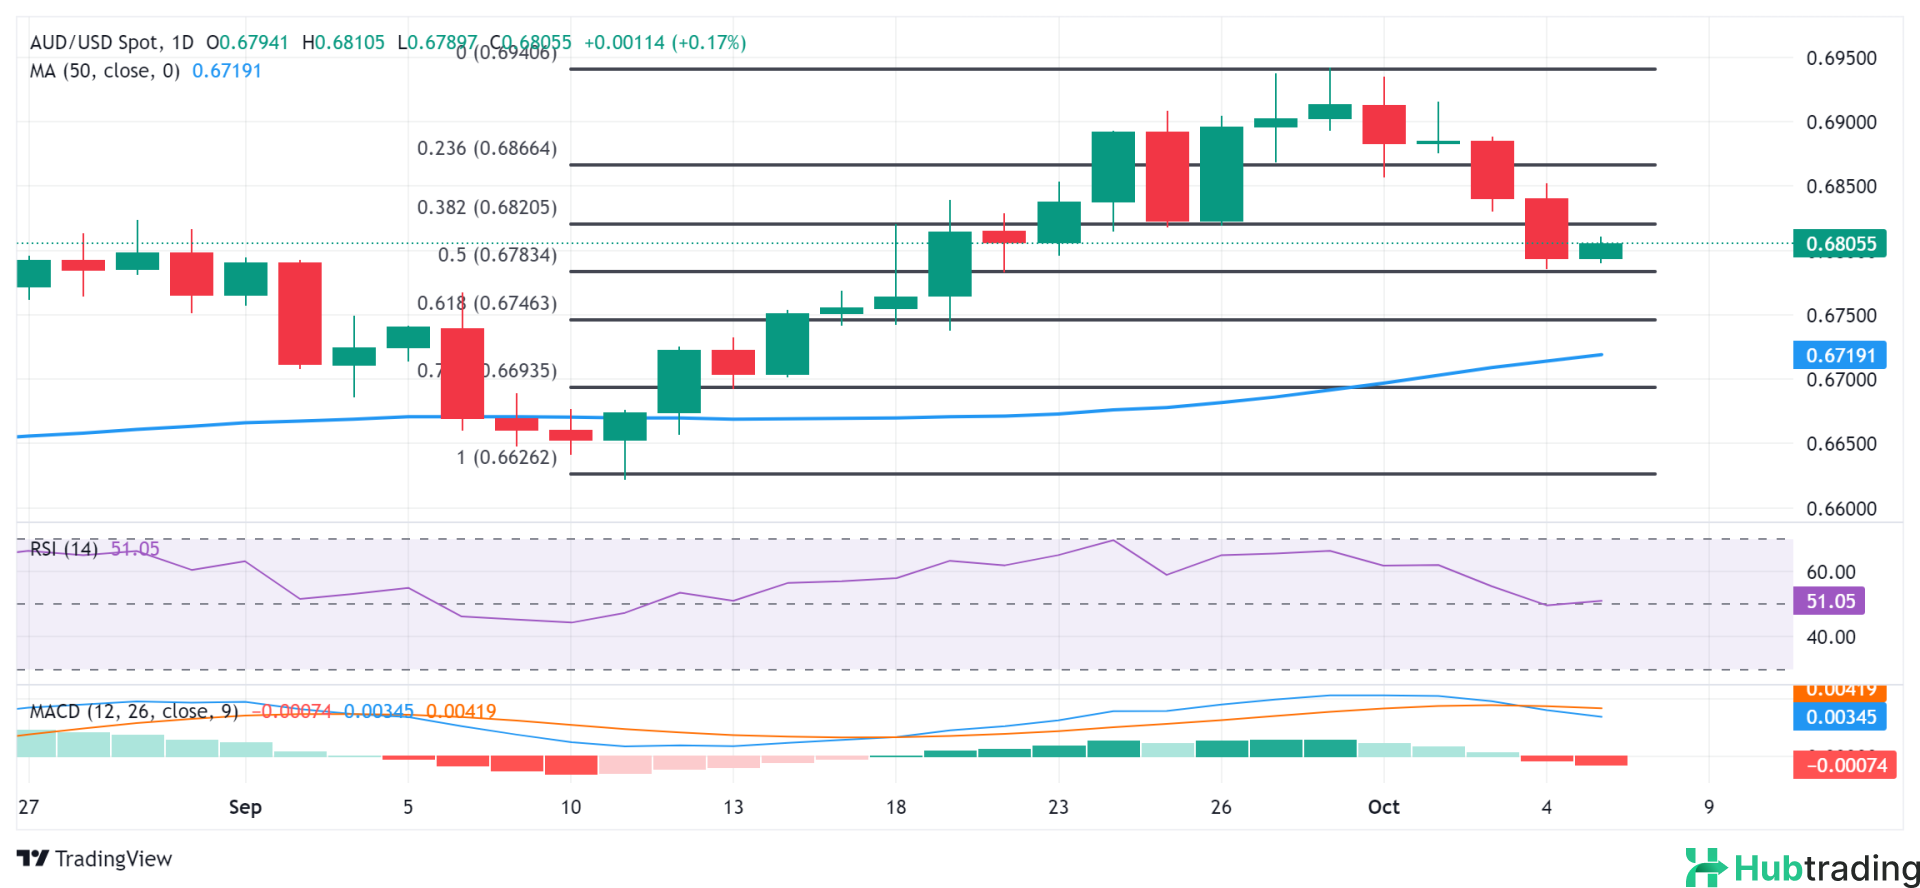
From a technical standpoint, spot prices found support near the 0.6785 region on Friday, aligning with the 50% Fibonacci retracement level of the September uptrend. The subsequent upward movement favors bullish traders, but oscillators on the daily chart are beginning to show negative traction, suggesting caution before positioning for further appreciation. The 0.6820 area, representing the 38.2% Fibonacci level, is expected to act as an immediate hurdle. A breakout above this level could lead to an acceleration toward the 0.6865-0.6870 region.
This latter level, near the 23.6% Fibonacci breakpoint, if cleared, would indicate that the corrective slide has concluded, prompting fresh buying. In that case, spot prices may aim to reclaim the 0.6900 round figure and extend momentum toward the 0.6940-0.6945 region, which represents the year-to-date (YTD) peak reached last week.
Conversely, bearish traders should wait for a sustained break and acceptance below the 50% Fibonacci level around the 0.6785 region before entering new positions. If this occurs, the AUD/USD pair could slide to the 61.8% Fibonacci level near the 0.6745 region, potentially dropping further toward sub-0.6700 levels or the 100-day Simple Moving Average (SMA).
AUD/USD daily chart