Is a bounce or breakout imminent for Brent crude oil?
The energy commodity has been forming lower highs and higher lows, resulting in a symmetrical triangle pattern on its 4-hour chart.
Keep an eye on the triangle’s support zone if you’re looking to catch the next move!
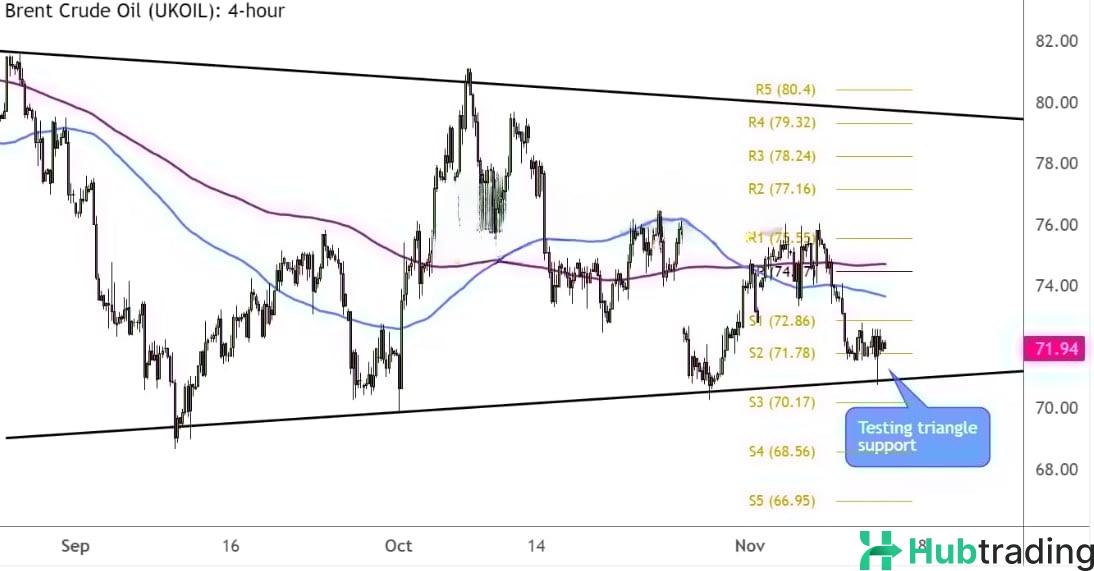
Brent Crude Oil (UKOIL): 4-Hour Chart Analysis
Brent crude oil bulls are facing challenges this week, as OPEC+ has once again downgraded global demand forecasts and highlighted increased production from non-OPEC countries. Additionally, U.S. President-elect Trump’s calls for increased domestic drilling have raised oversupply concerns, putting further pressure on oil prices.
Despite these factors, Brent crude is holding support at the base of a symmetrical triangle pattern that has remained intact since September. However, a potential breakdown may be on the horizon.
Currently, support around S2 ($71.78 per barrel) is helping to limit losses, which could give oil bulls an opportunity to target the pivot level at $74.47 per barrel or the nearby resistance at R1 ($75.55 per barrel). If bullish momentum persists, Brent crude could aim for the top of the triangle near R4 ($79.32 per barrel).
On the downside, a decisive move below the triangle’s support could open the door for a selloff, with further support levels at S3 ($70.17 per barrel) and S4 ($68.56 per barrel).
As always, be alert for any headlines that could impact market sentiment, and remember to apply proper position sizing to manage risk effectively.


