GBP/CAD Eyes Next Resistance Zones After Strong Rebound
This pound pair recently made an impressive bounce off a long-term support zone and could now be targeting the next bullish milestones. Let’s break down the key levels to watch.
How High Can GBP/CAD Climb?
Check out these potential inflection points!
GBP/CAD: 4-Hour Chart Analysis
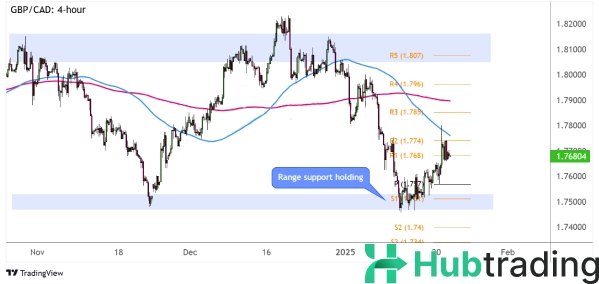
At the start of the year, Sterling faced a rough patch as surging U.K. bond yields raised concerns about the government’s spending plans, pushing GBP/CAD sharply down to the 1.7500 long-term support level.
However, bulls stepped in to defend this zone, while falling crude oil prices pressured the Loonie, allowing the pair to rebound.
Key Technical Levels to Monitor
- Current Resistance: The pair is hitting a roadblock at the 100 SMA dynamic resistance and the R2 level (1.7740). This could trigger a pullback toward near-term support zones or the S1 level (1.7510).
- Bullish Targets: Sustained momentum above the latest highs may open the door for a rally toward the R3 level (1.7850) or the range resistance at R5 (1.8070).
Fundamentals Matter
Directional bias and volatility often hinge on fundamental factors. Stay updated with the economic calendar and track key developments for the British pound and Canadian dollar.
Trading Tips
- Watch for long green candlesticks or a decisive break above resistance levels as signs of continued bullish momentum.
- Practice proper risk management, and be mindful of high-impact events that could shift market sentiment.
Whether you’re bullish or bearish, staying prepared and informed is key to navigating the market effectively!


