Gold (XAU/USD): 4-Hour Chart Analysis
![]()
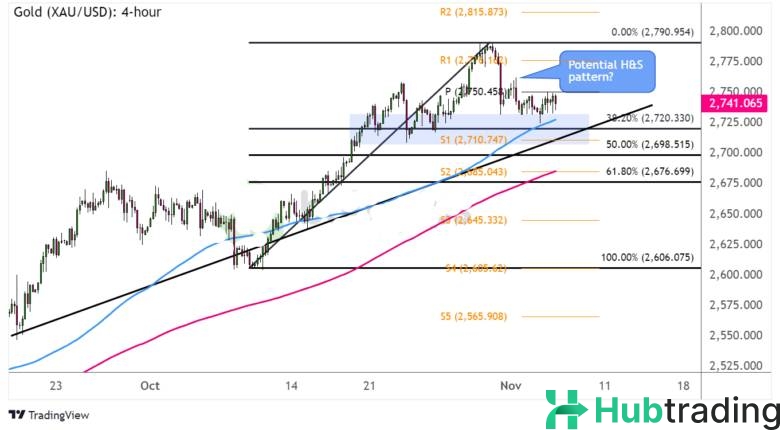
Gold traders are feeling uneasy ahead of the U.S. election results, as the precious metal hovers just above key support at $2,725. This level coincides with the potential neckline of a head and shoulders reversal pattern.
If the price breaks below this support, a reversal from the uptrend could follow, with the potential move mirroring the height of the chart pattern. However, there's also the possibility that gold could bounce off key Fibonacci retracement levels.
It's essential to keep in mind that price movements and volatility are often driven by fundamental factors. Make sure to check the economic calendar and stay informed on the latest news regarding gold and the U.S. dollar.
The neckline of the head and shoulders pattern aligns with the 38.2% Fibonacci retracement and the 100 SMA, which is above the 200 SMA, suggesting that a bullish trend could still push gold back up to the swing high near $2,775 or even higher.
If the price sees a larger correction, support may come from the 50% Fibonacci level near $2,700 or the 61.8% level around $2,676.70. This area aligns with the 200 SMA and could serve as a key support zone for a potential bullish reversal.
Watch for reversal candlestick patterns at these levels to gauge if the buying pressure will continue. Also, stay alert for any headlines or major economic events that could influence market sentiment throughout the week.