U.S. Dollar Index (DXY): 4-Hour Analysis
In case you missed it, the U.S. dollar had a strong start to the week, driven by rising U.S. bond yields and speculation surrounding persistent high inflation and elevated Fed interest rates under a potential Trump presidency. However, the Greenback has since relinquished some of its gains due to uncertainty ahead of the U.S. elections and a surprisingly weak advance Q3 GDP report.
Keep in mind that directional biases and market volatility are typically influenced by fundamental factors. If you haven't done your research on the U.S. dollar, now is the time to consult the economic calendar and stay updated on daily news.
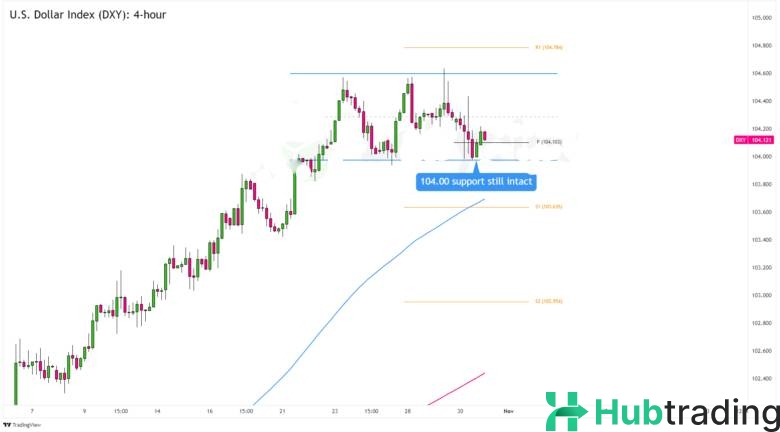
The U.S. Dollar Index (DXY) recently retested Friday's lows near 104.00, where it also encountered buying pressure at this psychological level.
Look for more green candlesticks forming above 104.00, which aligns with the Pivot Point line (104.10) and the range support area on the 4-hour chart. Continued gains could propel DXY toward the 104.30 mid-range level, or potentially to the 104.60 previous high and range resistance zone.
But what if the U.S. dollar bears are merely taking a pause?
If DXY sets new weekly lows and consistently trades below the range support, the odds of a longer-term bearish reversal for the Greenback could increase. Watch for sustained trading below 104.00, which may pull DXY down to the 103.60 S1 level or the 103.50 area of interest near the 100 SMA.
Good luck and happy trading with this setup!


