The critical question remains: will GBP/USD attract sufficient demand at this level to sustain its long-term trend? This insight is provided by Hubtrading as we take a closer look at the daily chart.
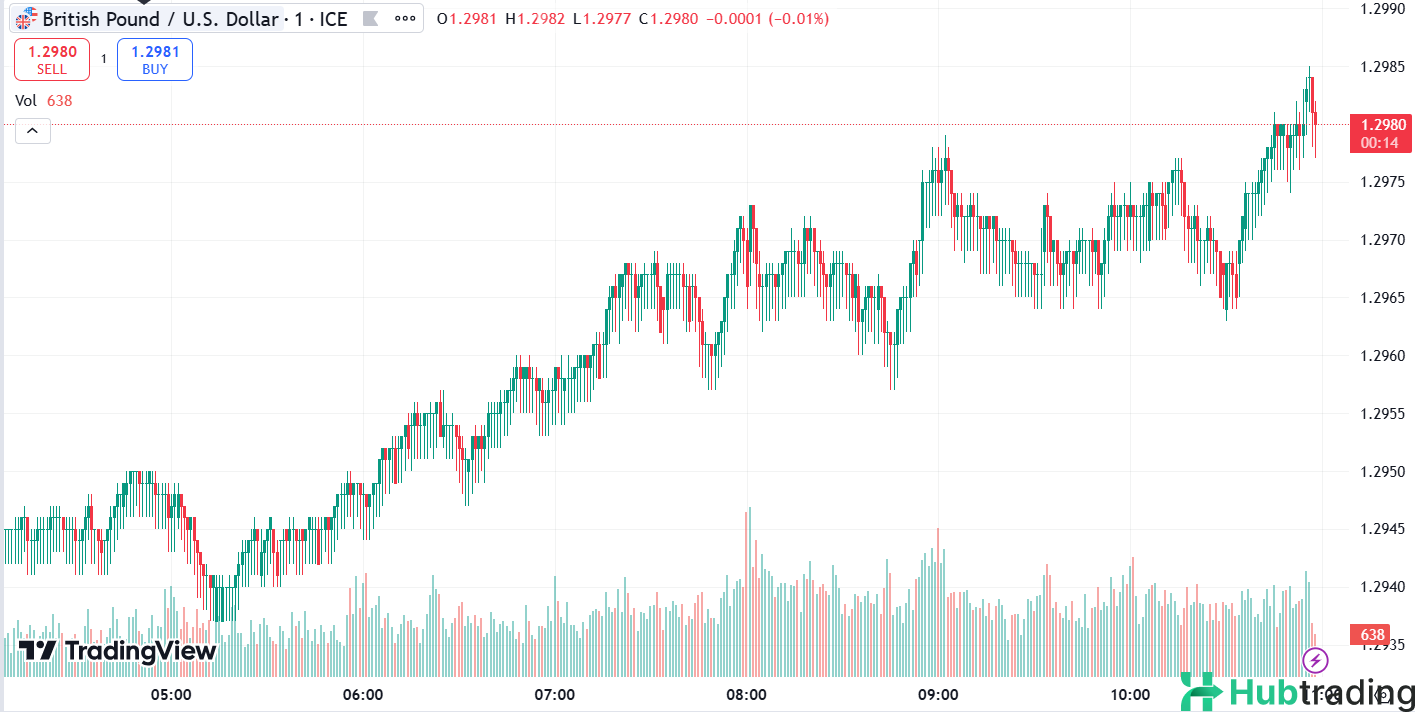
GBP/USD: 1-hour
In case you missed our latest FX Weekly Recap, it's important to note that the U.S. dollar received significant support from shifting Federal Reserve interest rate expectations and the potential for a Trump presidency, which could lead to higher inflation in the U.S. The British pound also showed resilience, maintaining its gains against riskier currency counterparts following a Bank of England (BOE) member's indication of higher terminal rates and a more gradual approach to easing policies.
As always, directional biases and volatility in market prices are primarily driven by fundamental factors. If you haven't done your due diligence on the U.S. dollar and the British pound, now is the time to check the economic calendar and stay informed about daily fundamental news. Currently, GBP/USD, which recently bounced lower from the 1.3400 resistance, is trading in a downtrend around the 1.2900 mark.
Will this week’s themes support GBP/USD's longer-term uptrend? We are focusing on the 1.2900 level, which is close to the daily chart's 100 Simple Moving Average (SMA) and a trendline support established in April. Bullish candlesticks and sustained trading above 1.2950 could position GBP/USD for a potential rebound from the 61.8% Fibonacci retracement of October’s downswing.
Conversely, if GBP/USD continues its decline, it may find robust bullish pressure near the 1.2800 psychological level, which coincides with S2 Pivot Point support and the 200 SMA area. However, if the pair begins to produce more bearish candlesticks or breaks below the trendline support, it could revisit previous inflection points around 1.2675 or 1.2550.
Whichever bias you choose to trade, ensure you stay updated on the potential catalysts that could influence GBP/USD prices!


