Bitcoin has surged in October, driven by expectations of "Uptober," favorable polling for crypto-friendly candidate Donald Trump, and potential Fed rate cuts. Currently, BTC/USD faces key resistance around $69,000, coinciding with a descending channel top. Watch for bearish signals below $68,000, which could lead to dips toward $64,000 or $60,000. However, a sustained move above $70,000 could open the door to new record highs. Always practice sound risk management.
Bitcoin (BTC/USD): Daily Analysis
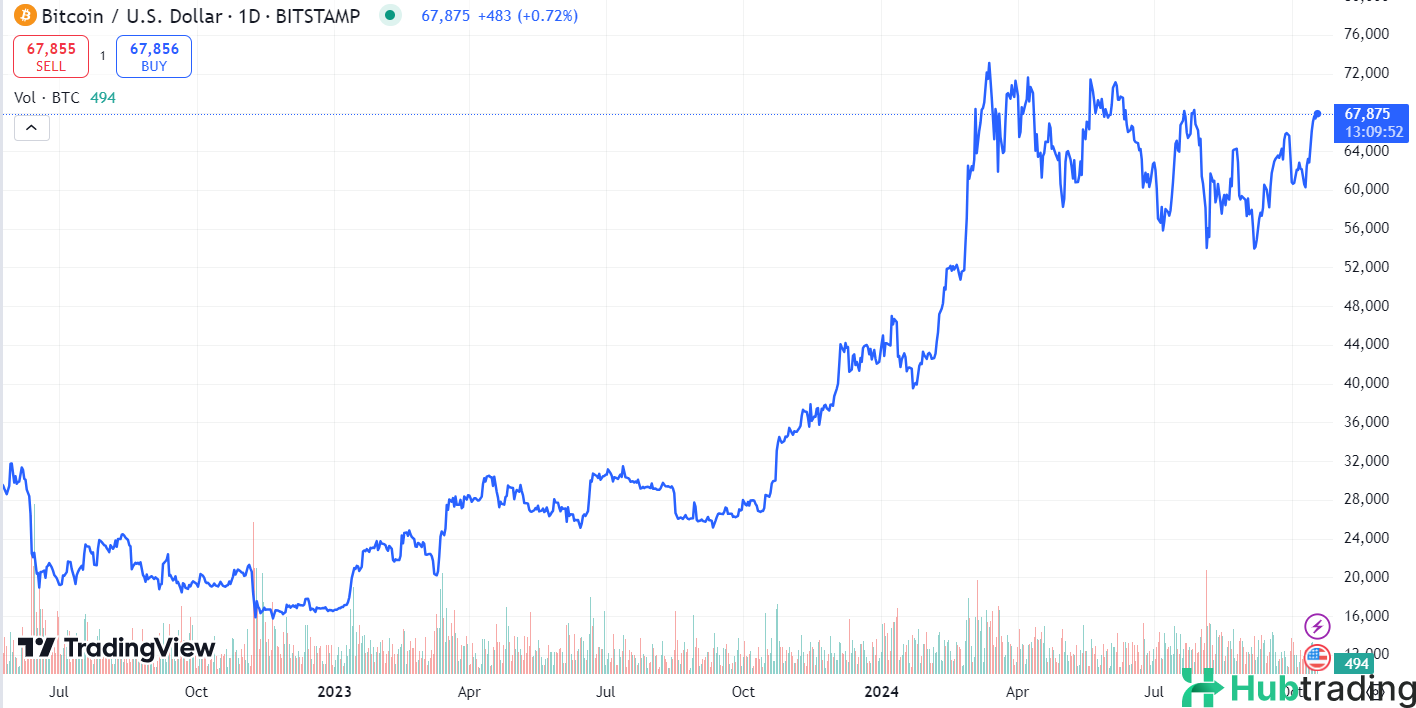
Bitcoin (BTC/USD) has experienced notable gains in recent weeks, buoyed by expectations of an "Uptober," a historically bullish period for the cryptocurrency. These gains have coincided with improved odds for crypto-friendly presidential candidate Donald Trump in key polls, as well as the market's optimistic outlook on potential rate cuts from the Federal Reserve. Additionally, expectations of looser monetary policies from other major central banks have bolstered risk sentiment and increased demand for BTC.
Currently, Bitcoin is facing a significant resistance zone around $69,000, aligning with the R1 ($69,025) Pivot Point and July's resistance level on the daily chart. This area is crucial, as it coincides with the upper boundary of a descending channel that has not been breached since March.
While BTC/USD is showing signs of hesitation with indecisive candlesticks near these levels, traders should watch for bearish signals, particularly if the price remains below $68,000. A sustained decline could lead BTC/USD back to the $64,000 support level, or even the psychological barrier of $60,000.
Conversely, if Bitcoin manages to break above $70,000, it could pave the way for new record highs. Regardless of your trading strategy, remember to implement proper risk management and stay alert to key market drivers. Good luck!


