Yesterday, Bitcoin (BTC/USD) briefly dipped below the $94,000 level but has since regained momentum, staying supported within a potential continuation chart pattern.
Let's analyze the 4-hour time frame more closely:
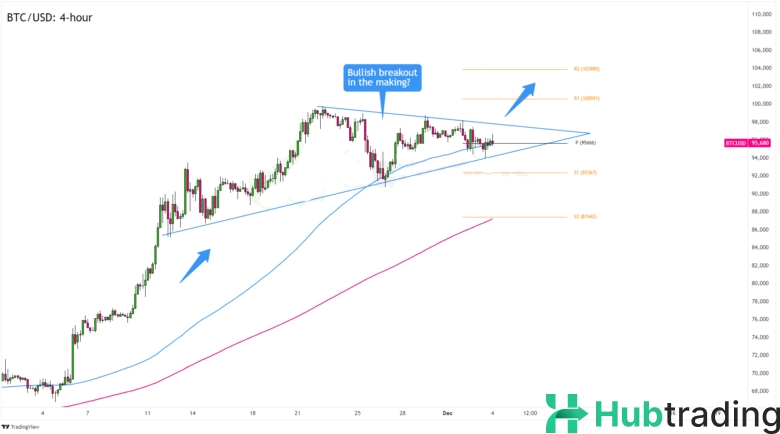
Bitcoin (BTC/USD) 4-Hour Chart: Is a Bullish Continuation Imminent?
Bitcoin (BTC/USD) experienced a brief dip below the $94,000 mark yesterday, triggered by geopolitical tensions in South Korea and a stronger U.S. dollar after a positive U.S. JOLTS jobs report. However, BTC/USD has since recovered, closing just under $96,000.
Currently, Bitcoin is trading near the Pivot Point line, above the 100-hour Simple Moving Average (SMA), and within a bullish pennant formation on the 4-hour chart. This setup suggests the potential for a continuation of the upward trend. A retest of the trendline resistance could spark a breakout, driving BTC/USD towards previous highs near $98,000, with a target of $100,000 in sight.
Conversely, if BTC/USD shows bearish candlesticks in the coming sessions and falls below the 100 SMA and Pivot Point support levels, it could signal a retreat towards the $92,000 area, particularly near the S1 Pivot Point zone ($92,367).
Keep an eye on any major fundamental catalysts, and make sure to manage your positions carefully, as market sentiment can quickly shift.


