U.S. crude oil prices nearly reached the $75.00 mark before pulling back to the $72.00 zone. What’s behind this move?
Several fundamental factors are at play:
- Tariff concerns eased after the U.S., Canada, and Mexico paused their trade restrictions.
- OPEC+ remains committed to increasing production in April, pressuring oil prices.
Now, let's dive into WTI’s 4-hour chart to see if the bulls have a chance to regain control.
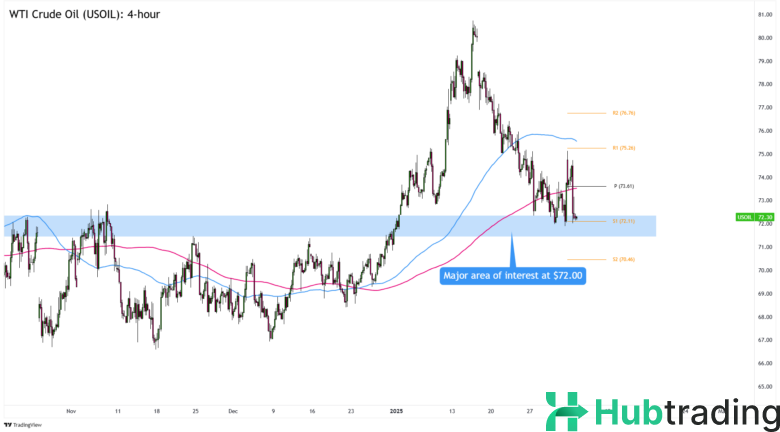
Technical Outlook – WTI Crude Oil (USOIL) 4-Hour Chart
WTI crude saw a sharp selloff but is currently stabilizing around the S1 Pivot Point at $72.11, a key level from late 2024.
![]()
? Bullish Scenario:
- If buying pressure emerges above $72.00, we could see a bounce toward the Pivot Point at $73.61 or even a retest of the $75.00 resistance zone.
- Look for bullish candlestick formations as confirmation.
? Bearish Scenario:
- A sustained break below $72.00 could open the door for a drop to the $70.00 psychological support.
- Watch for bearish candles and increased selling momentum.
Regardless of your trading bias, stay updated on key economic catalysts and always use proper risk management! ?