WTI crude oil has formed a descending triangle on its 4-hour chart, marked by lower highs and support at $67 per barrel. Is a breakout imminent?
WTI Crude Oil (USOIL): 4-hour
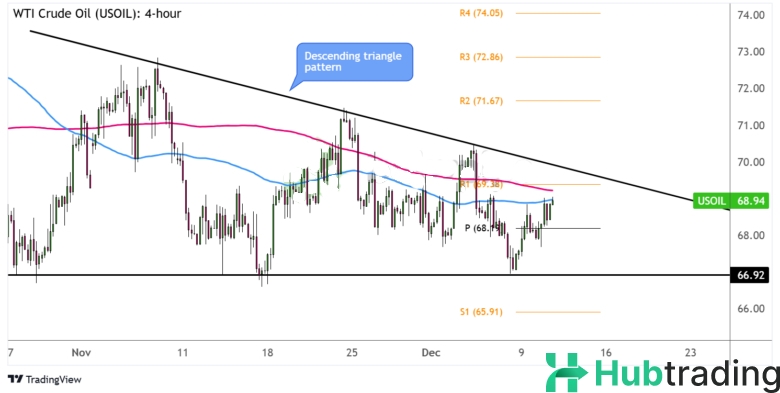
WTI crude oil has been fluctuating within a descending triangle pattern on its 4-hour chart, driven by fluctuating geopolitical tensions and global supply concerns. Recently, the commodity found support at the triangle’s lower boundary, as escalating violence in Syria and resurging supply fears contribute to upward pressure. Additionally, OPEC+’s decision to delay its planned production hike by three months has eased worries about a potential glut, helping lift WTI closer to its triangle resistance.
The 100 SMA remains below the 200 SMA, signaling a potential bearish bias, suggesting that resistance near $69.38 per barrel (R1) may hold. If this resistance is breached, the next target could be at $71.67 per barrel (R2), with $72.86 per barrel (R3) as a further bullish target.
However, a rejection at resistance could send prices back down to the support level or the pivot point at $68.19 per barrel. With market volatility often influenced by key fundamental events, traders should monitor updates on WTI crude oil and the US dollar closely and apply appropriate risk management strategies.


