- Oil prices rise by nearly 1%, with traders heading into the Christmas holidays.
- Markets respond to headlines about additional stimulus in China, one of the world’s top consumers.
- The US Dollar Index trades just below its two-year high, with volatility winding down.
Crude oil prices are rising on Tuesday as traders focus on the upcoming Christmas Eve holiday, rather than the release of the American Petroleum Institute (API) data. Oil prices are further supported by news of a 3 trillion Yuan bond injection in China, aimed at boosting economic activity and increasing demand for oil from the world’s largest consumer.
Meanwhile, the US Dollar Index (DXY) remains just below its two-year high, with volatility easing as the year-end approaches. At the time of writing, WTI crude is trading at $69.95, while Brent crude is at $72.85.
Oil News and Market Movers: China Demand Set to Rise
- Chinese policymakers plan to sell a record 3 trillion Yuan ($411 billion) in special treasury bonds in 2025 to support consumption subsidies, business upgrades, and investments in key sectors like technology and advanced manufacturing, as reported by Reuters.
- India’s state-owned oil refiners are struggling to meet their required volume of Russian crude, according to sources familiar with the situation, as reported by Bloomberg.
- Methane emissions in the US Permian Oil basin fell 26% last year, as companies implemented stricter operations and new technology to reduce leaks, according to an S&P Global Commodity Insights study.
- The American Petroleum Institute (API) will release its weekly Crude Stockpile Change data at 21:30 GMT, with the previous week showing a drawdown of 4.7 million barrels.
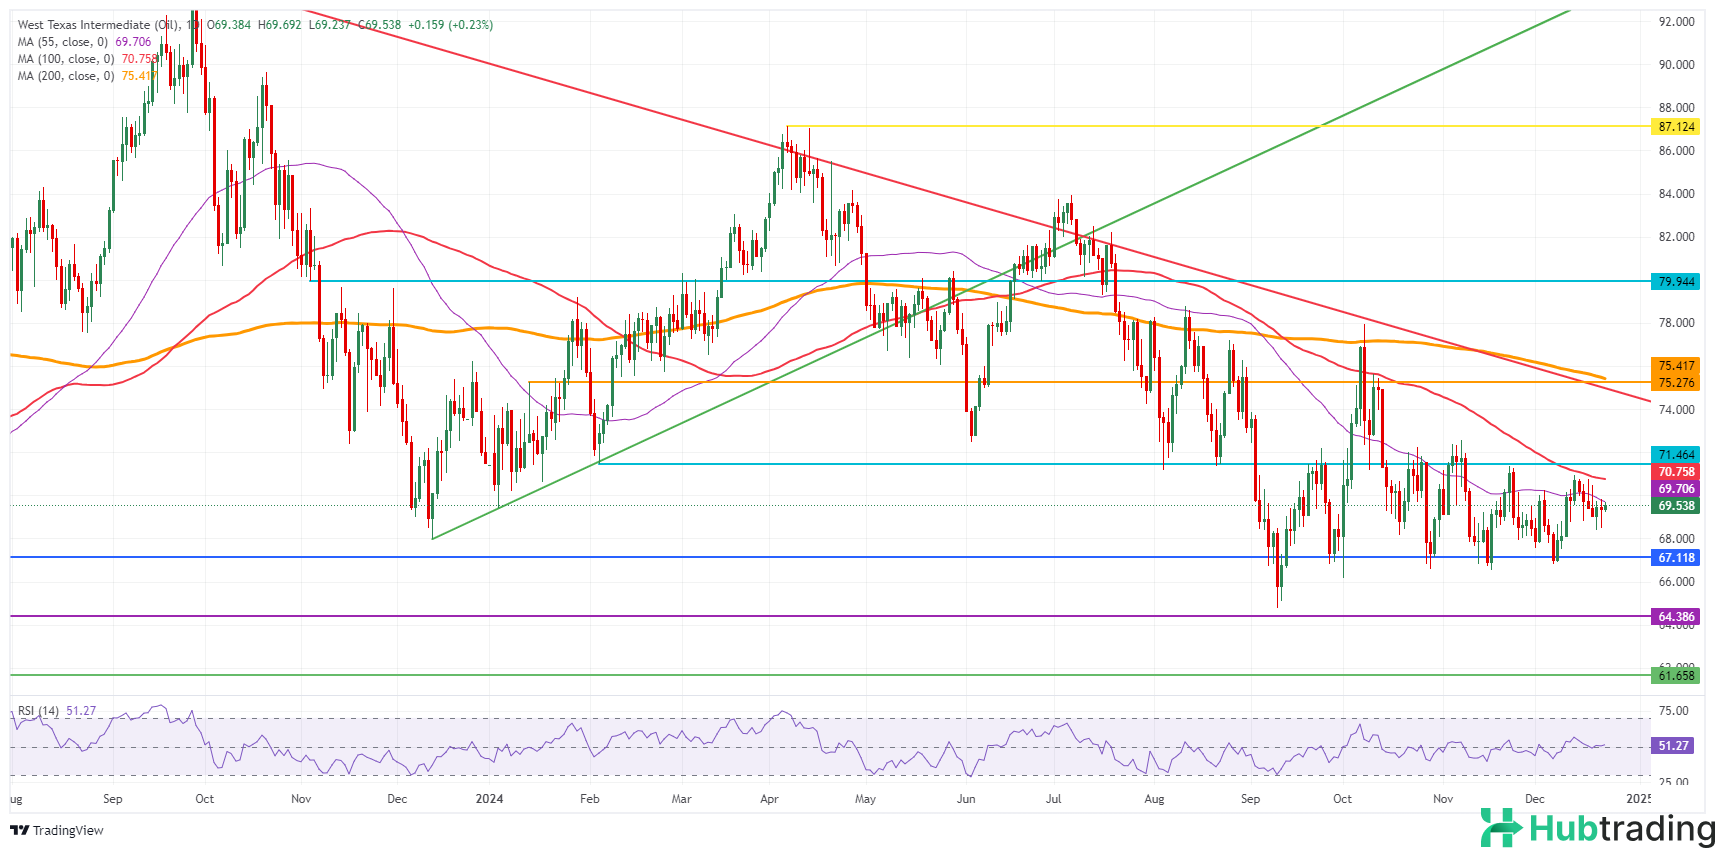
Oil Technical Analysis: Testing $70 Resistance
Crude Oil prices are struggling to make significant gains despite news that China plans a large 3 trillion Yuan (CNH) economic stimulus to boost local demand, which could support global oil consumption. However, the lack of detailed plans and low trading volume on Tuesday make a sharp move in Oil prices unlikely.
Looking upward, the 100-day Simple Moving Average (SMA) at $70.76 and the February 5 low of $71.46 are key resistance levels. If momentum picks up, the next critical level to watch is $75.27, the January 12 high. However, with the year-end approaching, profit-taking could limit further upside.
On the downside, support remains at $67.12, a level that held prices in mid-2023 and again in Q4. If this level is breached, the year-to-date low for 2024 at $64.75 becomes the next target, followed by the 2023 low at $64.38.