Crude Oil prices are experiencing a decline of more than 1% during the European trading session, following reports that Pemex, the Mexican state-owned oil producer, has fully resumed operations at all its platforms in the Gulf region. This comes as the annual hurricane season concludes and weather conditions improve, bringing more oil supply online.
The US Dollar Index (DXY), which tracks the performance of the USD against a basket of currencies, is strengthening against nearly all major currencies on Tuesday. The rally is largely driven by the strong preliminary US Purchasing Managers Index (PMI) for December, which showed the economy expanding at its fastest pace in 33 months, supported by growth in the services sector. Investors are also eyeing the upcoming US Retail Sales report and the Federal Reserve's rate decision on Wednesday.
At the time of writing, Crude Oil (WTI) is trading at $69.46, while Brent Crude is priced at $72.88.
Oil news and market movers: An API build could be a big setback for Oil prices
Oil prices may face pressure as Pemex reports that all its oil platforms and crude-exporting terminals are back to normal operations following improved weather conditions in the Gulf of Mexico, according to a statement from the group, as reported by Bloomberg.
In geopolitical news, the European Union has imposed sanctions on Dutch national Niels Troost, accusing him of engaging in the trade of Russian oil above the price cap set by Western nations in response to Russia's invasion of Ukraine, according to the Financial Times.
Later today, at around 21:30 GMT, the American Petroleum Institute (API) is set to release its weekly crude stockpile data for the week ending December 13. Last week, API reported a build of 0.499 million barrels.
Oil Technical Analysis: Range trading 2.0
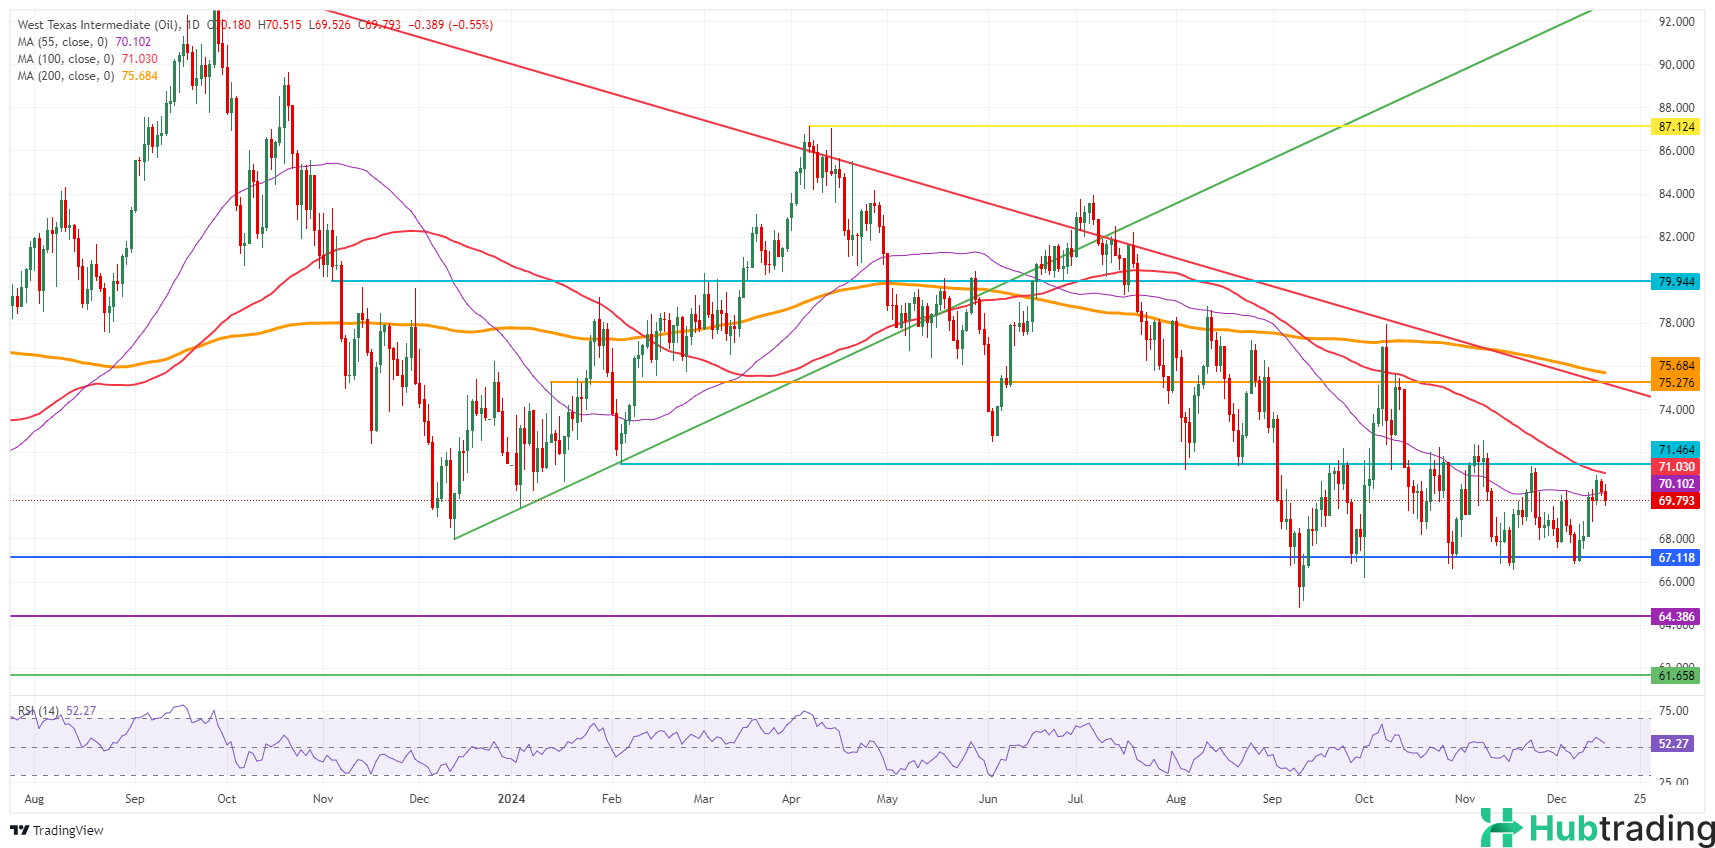
Crude oil prices are showing signs of softness on Tuesday, with the peak from last week at $70.96 potentially marking the high for the time being. A clear trading range is forming, with $67.00 acting as the lower boundary and $71.50 as the upper boundary. This range is expected to persist through January 2025.
On the upside, resistance levels are seen at $71.46 and the 100-day Simple Moving Average (SMA) at $71.03, where selling pressure emerged on Friday. If prices manage to break through these levels, $75.27 would be the next significant resistance, although quick profit-taking may occur as the year draws to a close.
On the downside, it remains uncertain whether the 55-day SMA at $70.12 will be reclaimed. If it doesn't, the first solid support is at $67.12, a level that held the price in May and June 2023. If this support breaks, the 2024 year-to-date low at $64.75 and the 2023 low at $64.38 will be key levels to watch.