Crude oil is struggling to stay above $68.00, with mounting bearish sentiment and little chance of a meaningful rebound. The monthly OPEC report provided some support, but its impact was limited. OPEC's decision to downgrade its global oil demand forecast for 2025 for the fourth time was seen as acknowledging an already obvious trend, contributing to renewed selling pressure on oil this Wednesday.
Meanwhile, the US Dollar Index (DXY), which tracks the Greenback against six major currencies, is holding steady after a slight uptick earlier in the day. All eyes are now on the upcoming October Consumer Price Index (CPI) report. A rise in inflation could dampen expectations for a rate cut in December, particularly after Minneapolis Fed President Neel Kashkari cautioned that a rate reduction is far from certain.
As of writing, Crude Oil (WTI) is trading at $68.25, while Brent Crude sits at $71.92.
Key Oil News and Market Movers:
- API Crude Inventory Build: Crude stocks in the Amsterdam-Rotterdam-Antwerp region increased by 1.1 million barrels in the week ending November 8, reaching a total of 51.7 million barrels, according to Genscape data.
- Chinese Refinery Shutdown: Cnooc’s Huizhou Phase II refinery in China halted operations on Tuesday due to production fluctuations, as reported by the city’s fire department.
- Iranian Oil Exports: The Abadan Oil refinery in Iran has taken measures to ensure stable oil exports despite ongoing challenges under the Trump administration, according to Reuters.
- API Report Due: The American Petroleum Institute (API) will release its weekly crude inventory data at 21:30 GMT. Last week, the API reported a surprise build of 3.132 million barrels.
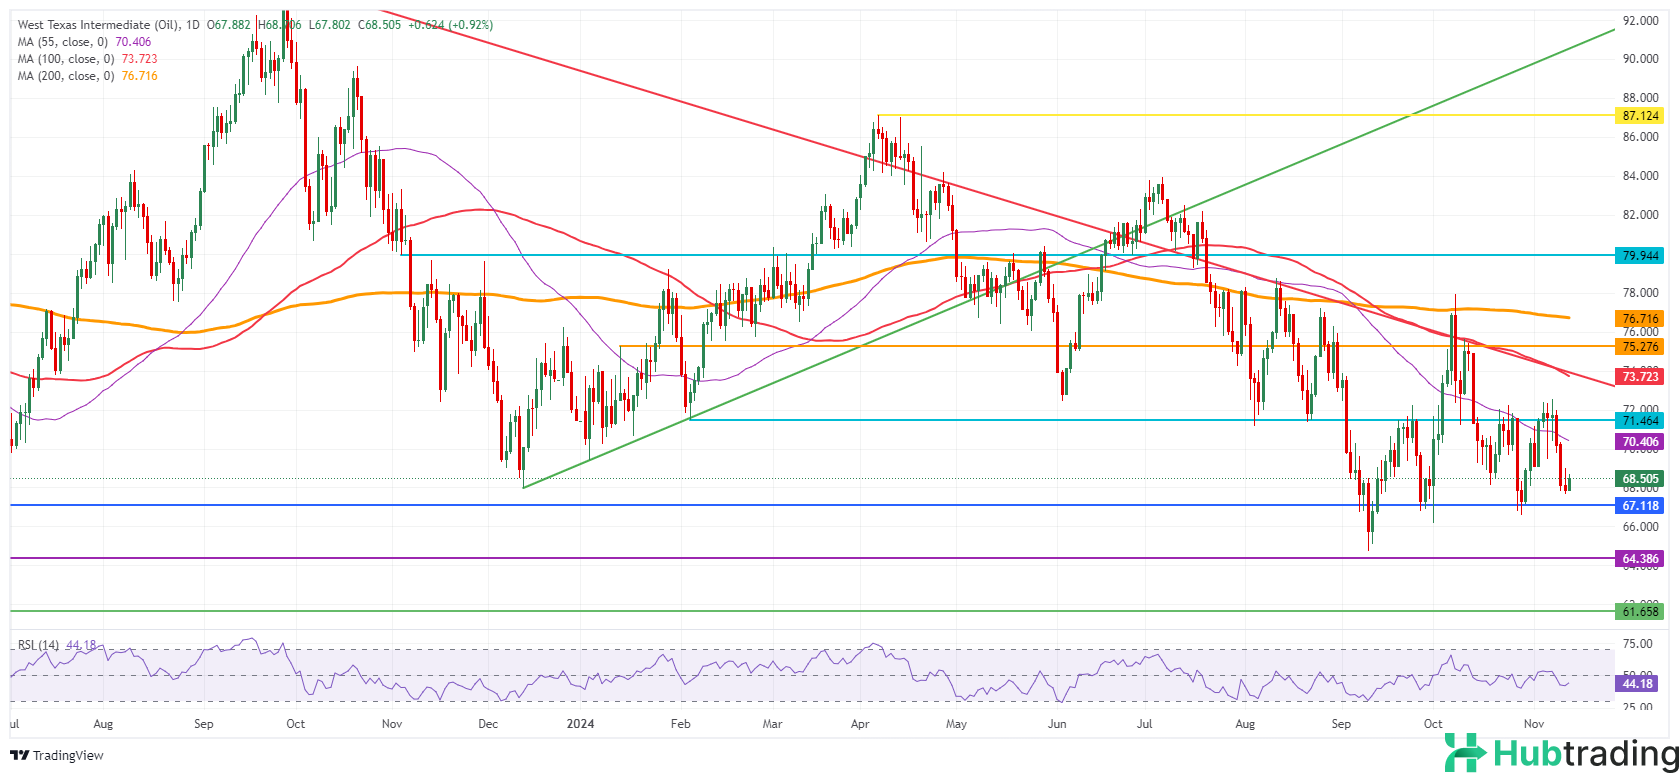
Technical Analysis: Bearish Outlook Persists
Crude oil prices remain under significant selling pressure and show no signs of recovery. OPEC's fourth revision of its demand forecast has had little to no impact, and unless there's a major shift in the supply-demand balance, oil prices are expected to continue drifting lower.
On the upside, the first resistance level is at the 55-day Simple Moving Average (SMA) around $70.40, followed by a stronger technical level at $73.72, where the 100-day SMA and other key indicators converge. The 200-day SMA at $76.71 is a distant target but could come into play if Middle East tensions flare.
To the downside, traders should watch for a potential test of $67.12, a key support level that held prices in May and June 2023. A break below that level could send prices to the year-to-date low of $64.75, followed by $64.38, the 2023 low.