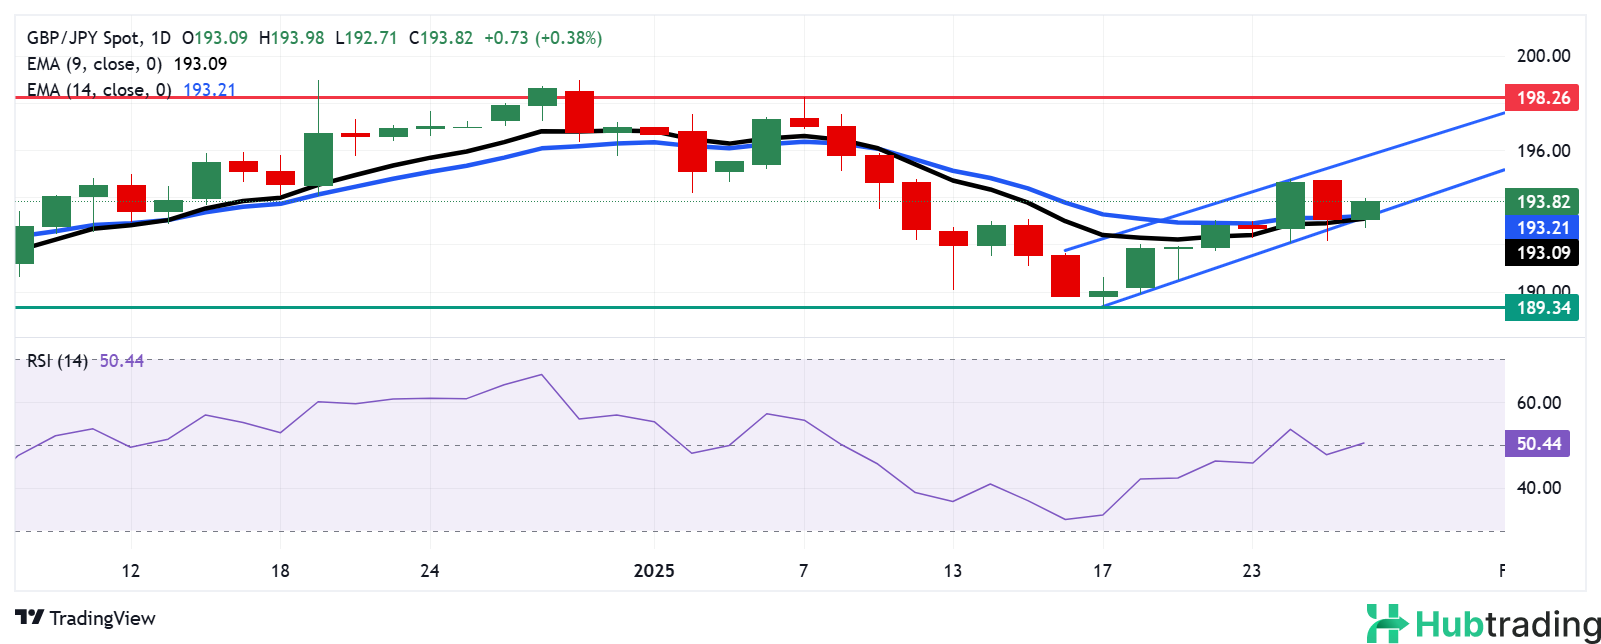
- GBP/JPY may test key support near the 14-day EMA at 193.21, followed by the ascending channel’s lower boundary.
- The 14-day RSI remains below 50, signaling prevailing bearish momentum.
- Resistance lies near the upper boundary of the ascending channel, around the 195.90 level.
GBP/JPY recovers recent losses from the previous session, trading near 193.80 during European hours on Tuesday. The daily chart analysis shows the pair remains close to the lower boundary of its ascending channel, signaling a potential weakening of the bullish bias.
The 14-day Relative Strength Index (RSI), a key momentum indicator, remains slightly below 50, suggesting bearish momentum is still in play. Further price movement is needed to confirm a clearer directional trend.
Despite this, GBP/JPY holds above the 14- and 9-day Exponential Moving Averages (EMAs), indicating that short-term momentum remains intact. A continued move along these EMAs would reinforce the bullish outlook.
On the downside, key support lies near the 14-day EMA at 193.21, followed by the 9-day EMA at 193.09, which aligns with the ascending channel’s lower boundary. A decisive break below this zone could intensify bearish pressure, potentially driving the pair toward the eight-week low of 189.34, recorded on January 17.
Conversely, on the upside, the pair may retest primary resistance at the ascending channel’s upper boundary near 195.90. A breakout above this level would strengthen the bullish bias and could pave the way toward the January high of 198.26, achieved on January 7.
GBP/JPY daily chart