- GBP/USD trades above the descending channel, indicating a softening bearish outlook.
- Key support is located at the channel’s upper boundary near 1.2540.
- Immediate resistance is seen at the nine-day EMA around 1.2565.
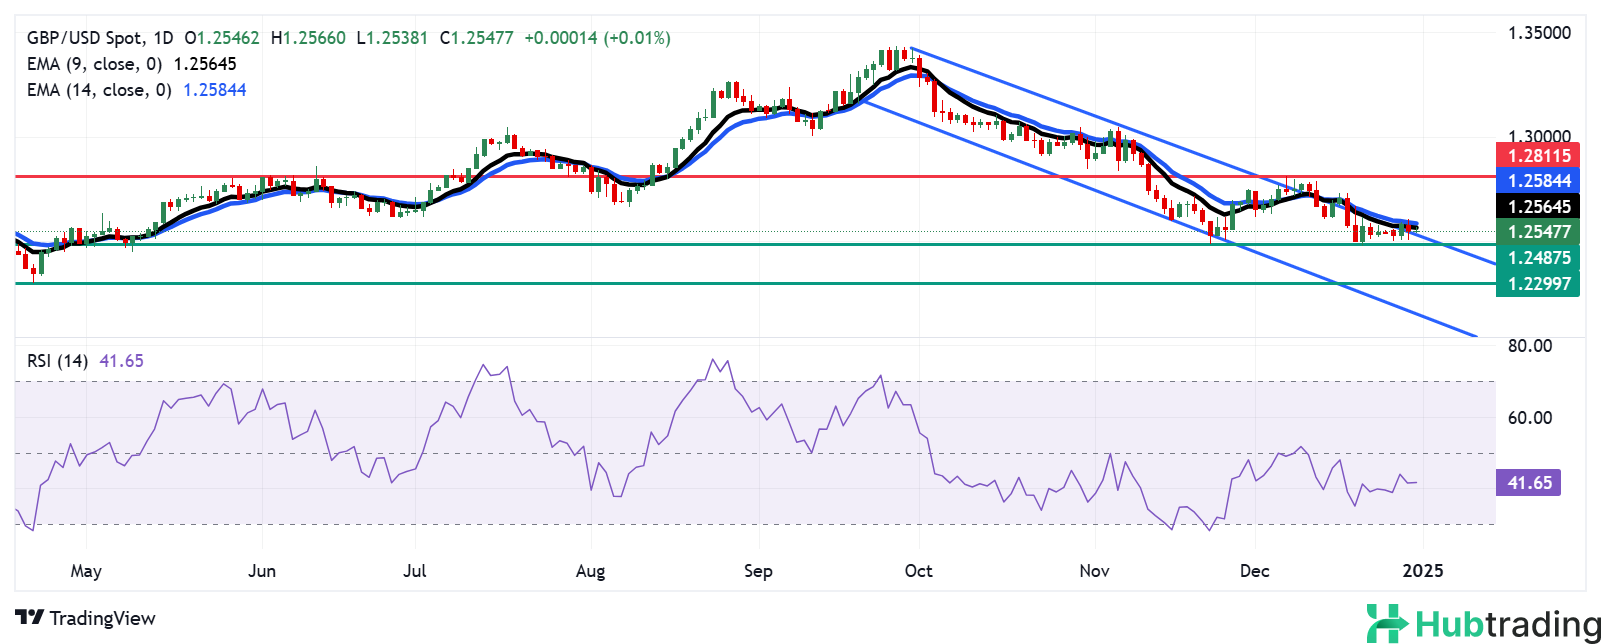
GBP/USD recovers recent losses, trading near 1.2550 during Tuesday’s European session. A review of the daily chart indicates a softening bearish bias as the pair holds above the upper boundary of the descending channel pattern.
Despite this, the 14-day Relative Strength Index (RSI) remains below 50, signaling ongoing bearish sentiment. The pair also trades below its nine- and 14-day Exponential Moving Averages (EMAs), reflecting weak short-term momentum. A breakout above these EMAs could signal a potential shift to bullish territory.
On the downside, support is seen near the channel’s upper boundary at 1.2540. A return below this level would reinforce bearish sentiment, with the pair potentially retesting the seven-month low of 1.2487, recorded on November 22. A break below this low could drive the pair toward the yearly low of 1.2299, recorded on April 22, and further to the channel’s lower boundary near 1.2160.
On the upside, immediate resistance is positioned at the nine-day EMA of 1.2565, followed by the 14-day EMA at 1.2585. A break above these levels could strengthen bullish momentum, paving the way for a retest of the six-week high of 1.2811, reached on December 6.
GBP/USD: Daily Chart