- GBP/USD extends its decline, falling below the 200-day SMA, signaling further downside potential.
- Technical indicators point to sustained bearish momentum, with immediate support at 1.2665.
- A rebound above 1.2700 could challenge resistance near the recent peak of 1.2873.
The Pound Sterling is experiencing losses against the US Dollar in early North American trading, driven by hawkish comments from Bank of England's Catherine Mann. This, along with the latest US inflation data aligning with expectations, has kept GBP/USD around 1.2697, marking a decline of over 0.37%.
GBP/USD Price Forecast: Technical Overview
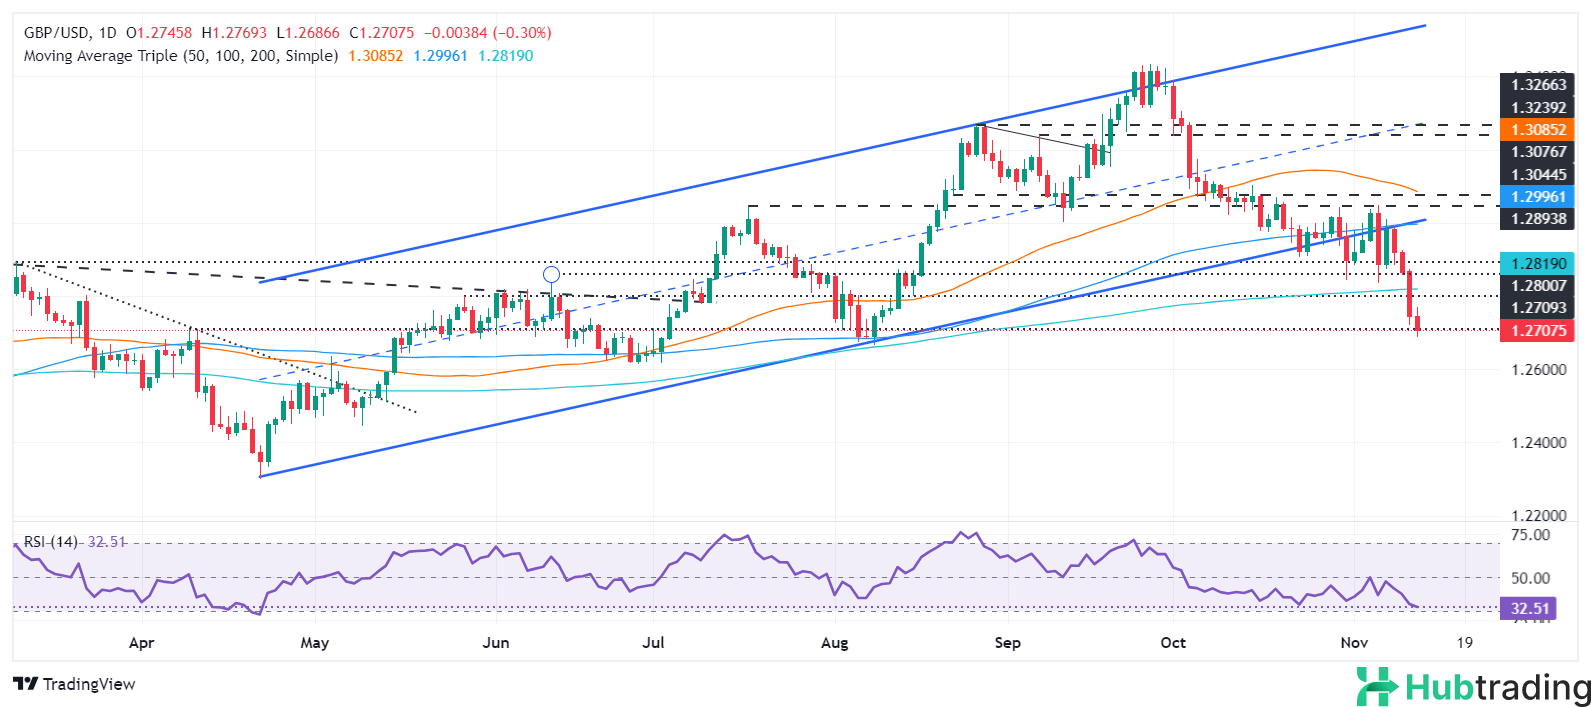
The bearish momentum in GBP/USD extended after the pair broke below the 1.2817 level and the 200-day Simple Moving Average (SMA), opening the door for a potential test of 1.2700. The pair reached a daily low of 1.2686, approaching key support at the August 8 swing low of 1.2665. If this level is breached, the next support could be around 1.2600.
On the upside, buyers will need to push the exchange rate above 1.2700. A break above this level could see the pair target the November 12 high at 1.2873.
Technical indicators, including the Relative Strength Index (RSI), suggest that sellers remain in control, supporting the outlook for further downside in GBP/USD.
GBP/USD Daily Chart