- GBP/USD holds above the 100-day SMA at 1.2967, with a move above 1.3000 potentially opening targets at 1.3015 and the weekly high of 1.3057.
- RSI indicates mild bullish momentum, though the bias remains bearish below the neutral line, reinforcing resistance at the 1.3000 level.
- Sellers must push below 1.2967 to confirm a bearish shift, with additional support near the lower trendline around 1.2925/35.
The British Pound recovered some ground, trading around a three-day high near 1.2998 but remaining just below the 1.3000 level at the time of writing. Market sentiment has slightly improved, acting as a headwind for the US Dollar, though the Greenback is still on track for weekly gains exceeding 0.50%.
GBP/USD Price Forecast: Technical Outlook
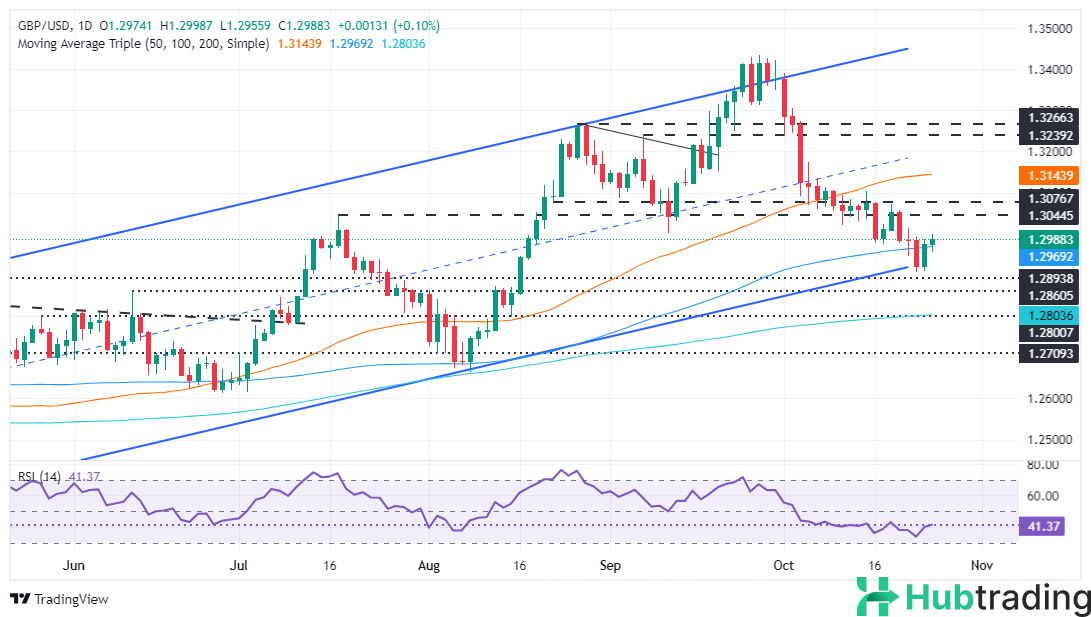
GBP/USD currently trades above the 100-day Simple Moving Average (SMA) at 1.2967, with buyers aiming to break the 1.3000 level. The Relative Strength Index (RSI) remains below its neutral line, showing a mild upward tilt in the short term.
If buyers can push GBP/USD above 1.3000, the next targets would be the October 22 high at 1.3015, followed by the weekly peak at 1.3057. Conversely, a break below the 100-day SMA could lead sellers to target the lower trendline of the ascending channel near 1.2925/35.
GBP/USD Price Chart Daily