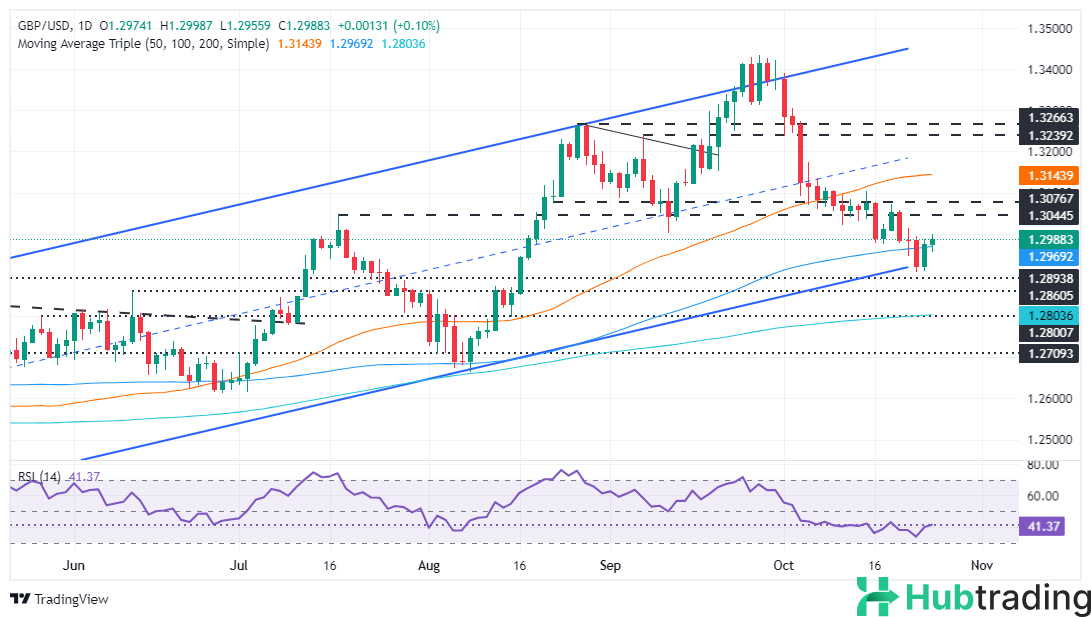
- GBP/USD remains above the 100-day SMA at 1.2967; a breakout above 1.3000 could target 1.3015 and the weekly high of 1.3057.
- The RSI indicates mild bullish momentum, but the overall bias remains bearish below the neutral line, reinforcing resistance at the 1.3000 level.
- Sellers must break below 1.2967, with additional support located at the bottom trendline near 1.2925/35 to facilitate a bearish shift.
The Pound Sterling made a modest recovery, trading around three-day highs of 1.2998, but struggled to break the 1.3000 level at the time of writing. While market sentiment has improved slightly, this poses a challenge for the Greenback, which is nonetheless on track for weekly gains of over 0.50%.
GBP/USD Price Forecast: Technical Outlook
GBP/USD is currently trading above the 100-day Simple Moving Average (SMA) at 1.2967, with buyers attempting to surpass the 1.3000 threshold. The Relative Strength Index (RSI) remains bearish below its neutral line, though it has a slight upward tilt in the short term.
If buyers manage to push GBP/USD above 1.3000, prices could advance to the October 22 high of 1.3015, followed by the weekly peak of 1.3057. Conversely, sellers will need to drive GBP/USD below the 100-day SMA, targeting the bottom trendline of an ascending channel around 1.2925/35.
GBP/USD Price Chart – Daily