-
GBP/USD climbs on Thursday, lifted by softer US PPI data and a surge in Initial Jobless Claims.
-
UK GDP contracted by 0.3% in April, marking the sharpest monthly decline since late 2022.
-
Markets are now pricing in 52 basis points of Fed rate cuts by year-end, putting pressure on the US Dollar.
The British Pound (GBP) extended its rally against the US Dollar (USD) on Thursday, fueled by fresh US inflation data and rising jobless claims that reinforced expectations of a Federal Reserve (Fed) rate cut. The GBP/USD pair traded near 1.3600, up over 0.47% on the day, as soft US economic figures weakened the Greenback across the board.
Sterling Gains on Weak US Data, Overshadowing UK Contraction
The US Bureau of Labor Statistics reported that the Producer Price Index (PPI) rose 2.6% year-over-year in May, slightly higher than April’s 2.4%. However, core PPI, which strips out food and energy, dipped to 3.0% from 3.1%, signaling easing price pressures in the US. Alongside this, Initial Jobless Claims came in at 248,000 for the week ending June 7—unchanged from the prior reading but higher than the expected 240,000—highlighting a cooling labor market.
The softer inflation backdrop, coupled with rising unemployment claims, has led investors to fully price in 52 basis points of Fed rate cuts by the end of 2025. Despite the ongoing effects of trade policies enacted under the Trump administration, inflation remains subdued, keeping the USD under pressure.
Meanwhile, UK GDP shrank by 0.3% month-over-month in April, marking the largest contraction since late 2022. The weak reading has led markets to price in two rate cuts from the Bank of England (BoE) in 2025. However, the data failed to drag down the Pound, with global USD weakness dominating market sentiment.
Looking ahead, the UK economic calendar is light, while US traders will focus on the University of Michigan Consumer Sentiment report for further guidance.
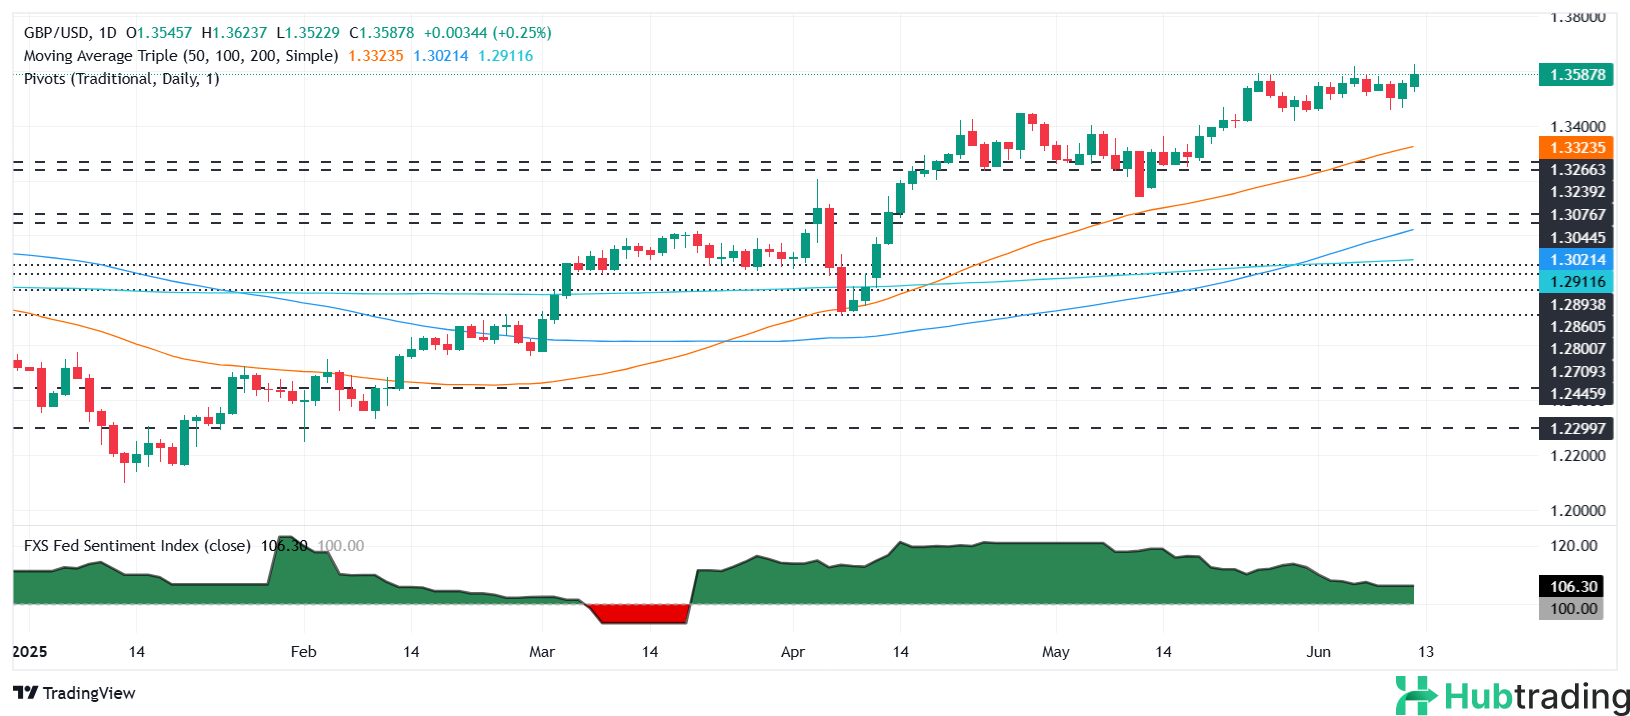
GBP/USD Technical Outlook: Bullish Momentum Intact
Technically, GBP/USD remains in an uptrend, with the pair touching a fresh yearly high of 1.3623 before slightly retreating. The Relative Strength Index (RSI) is approaching overbought territory, reflecting strong bullish momentum.
Immediate resistance lies at the YTD high of 1.3626, followed by 1.3700 and 1.3750. On the downside, a move below 1.3600 could see the pair testing the 20-day Simple Moving Average (SMA) at 1.3521, then 1.3500, and the 50-day SMA near 1.3319.