- Gold price attempts to recover from Monday’s decline.
- Reports from Trump’s administration suggest a gradual tariff rollout to mitigate inflation risks.
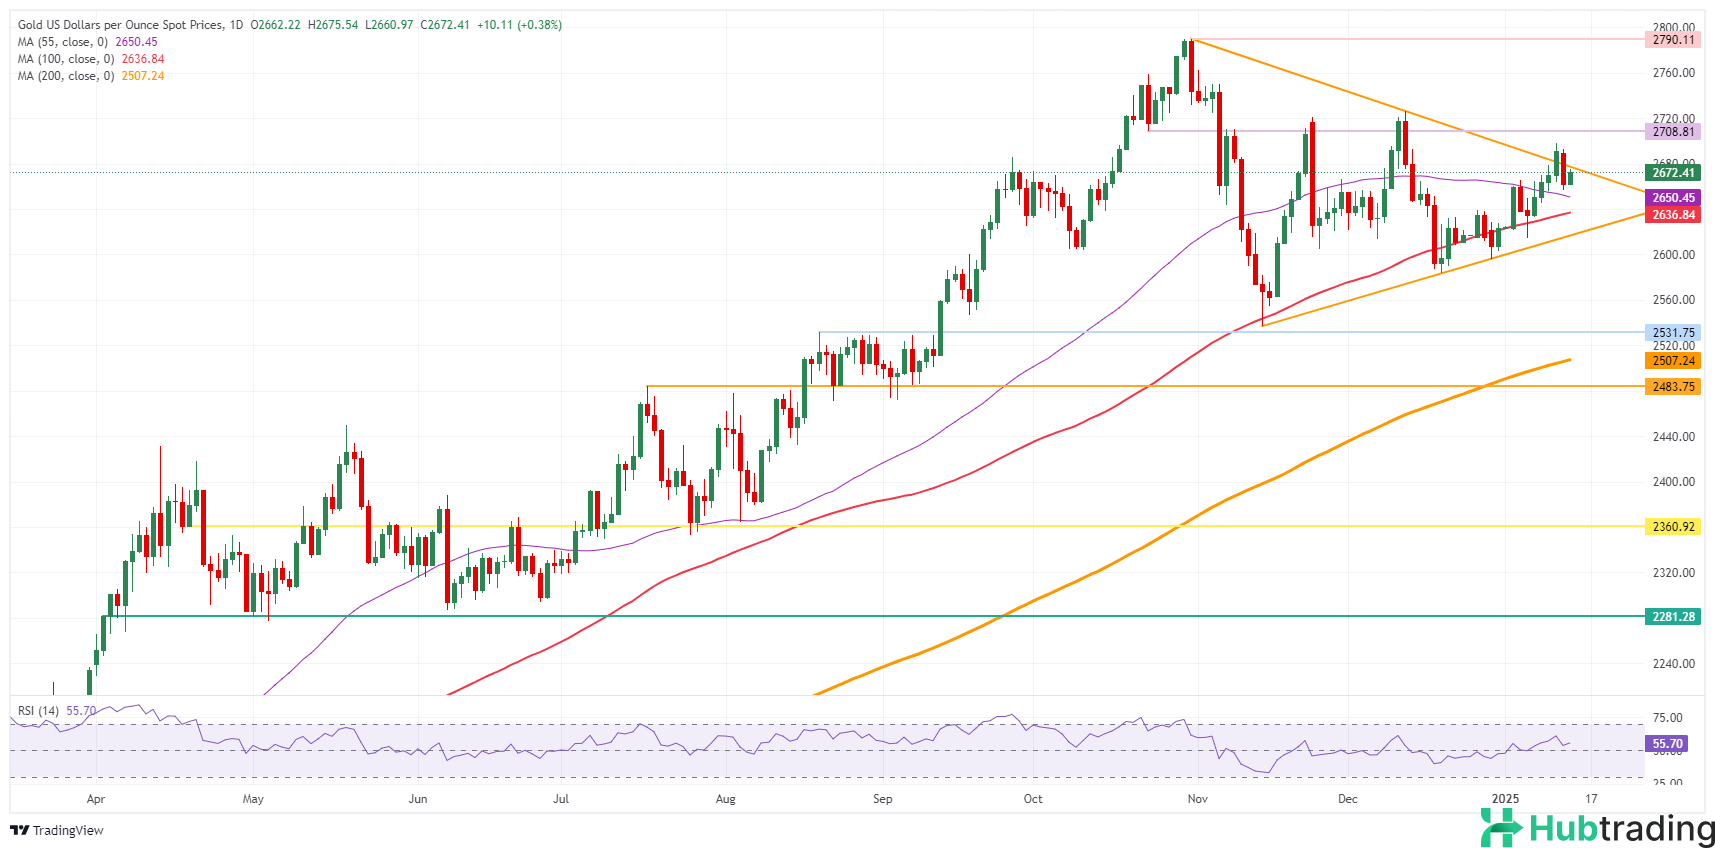
- Gold seeks to stay clear of slipping back into a long-term pennant pattern.
Gold (XAU/USD) finds support after Monday’s downturn driven by Federal Reserve (Fed) policy concerns, recovering modestly to trade near $2,670 as of Tuesday. Market sentiment has shifted following reports that President-elect Donald Trump’s administration is considering a gradual rollout of its tariff plans. Sources suggest the move is aimed at avoiding an inflation shock, signaling a more measured approach.
On the economic data front, traders should remain cautious ahead of the US Consumer Price Index (CPI) release on Wednesday, with the Producer Price Index (PPI) data due Tuesday. Any upside surprise in PPI could trigger sharp moves in yields and fuel expectations for a hotter-than-anticipated CPI.
If both PPI and CPI exceed forecasts, US yields could rise sharply, counteracting Tuesday’s optimism over gradual tariff implementation. This would further reduce the likelihood of a Fed rate cut in 2025, potentially eliminating it entirely.
Daily Market Movers Digest: Trump’s Tariff Plans Adjusted
- Gradual Tariff Rollout: Sources within President-elect Donald Trump’s administration are reportedly discussing a gradual implementation of tariffs to avoid triggering a spike in inflation, according to Bloomberg.
- US Yields Decline: The 10-year US Treasury yield dips to 4.753% on Tuesday, retreating from Monday’s 14-month high of 4.802%.
- Fed Rate Expectations: The CME FedWatch Tool indicates a 47.2% probability that the Federal Reserve will maintain current rates through its June 18 meeting, compared to 52.8% odds for a rate cut.
- Gold Positions Surge: The Commodity Futures Trading Commission (CFTC) reported an increase in Gold NC Net Positions to $254,900, up from $247,300. The data reflects growing speculative long positions, signaling bullish sentiment in futures markets. Traders monitor these figures to assess market trends and sentiment.
Technical Analysis: Risk of a Pullback
Gold has retreated into the broader pennant pattern that has defined its price action since November, raising the possibility that the upper boundary of the formation could now act as resistance. A decisive rejection at this level could trigger another downward move toward $2,650 or lower.
Key Support Levels:
- The 55-day Simple Moving Average (SMA) at $2,650 serves as the first line of defense.
- Below that, the 100-day SMA at $2,635 provides additional support.
- The lower boundary of the pennant, marked by an ascending trend line currently near $2,615, is expected to limit further downside.
Key Resistance Levels:
- On the upside, the October 23 low of $2,708 is the next significant hurdle.
- A sustained break above this level would shift focus toward the all-time high of $2,790 as the primary upside target.