- Gold is retreating within its range as markets adjust their forecasts for China, the world’s largest consumer of the precious metal.
- Despite this, gold finds support from ETF inflows and safe-haven demand amid heightened geopolitical tensions.
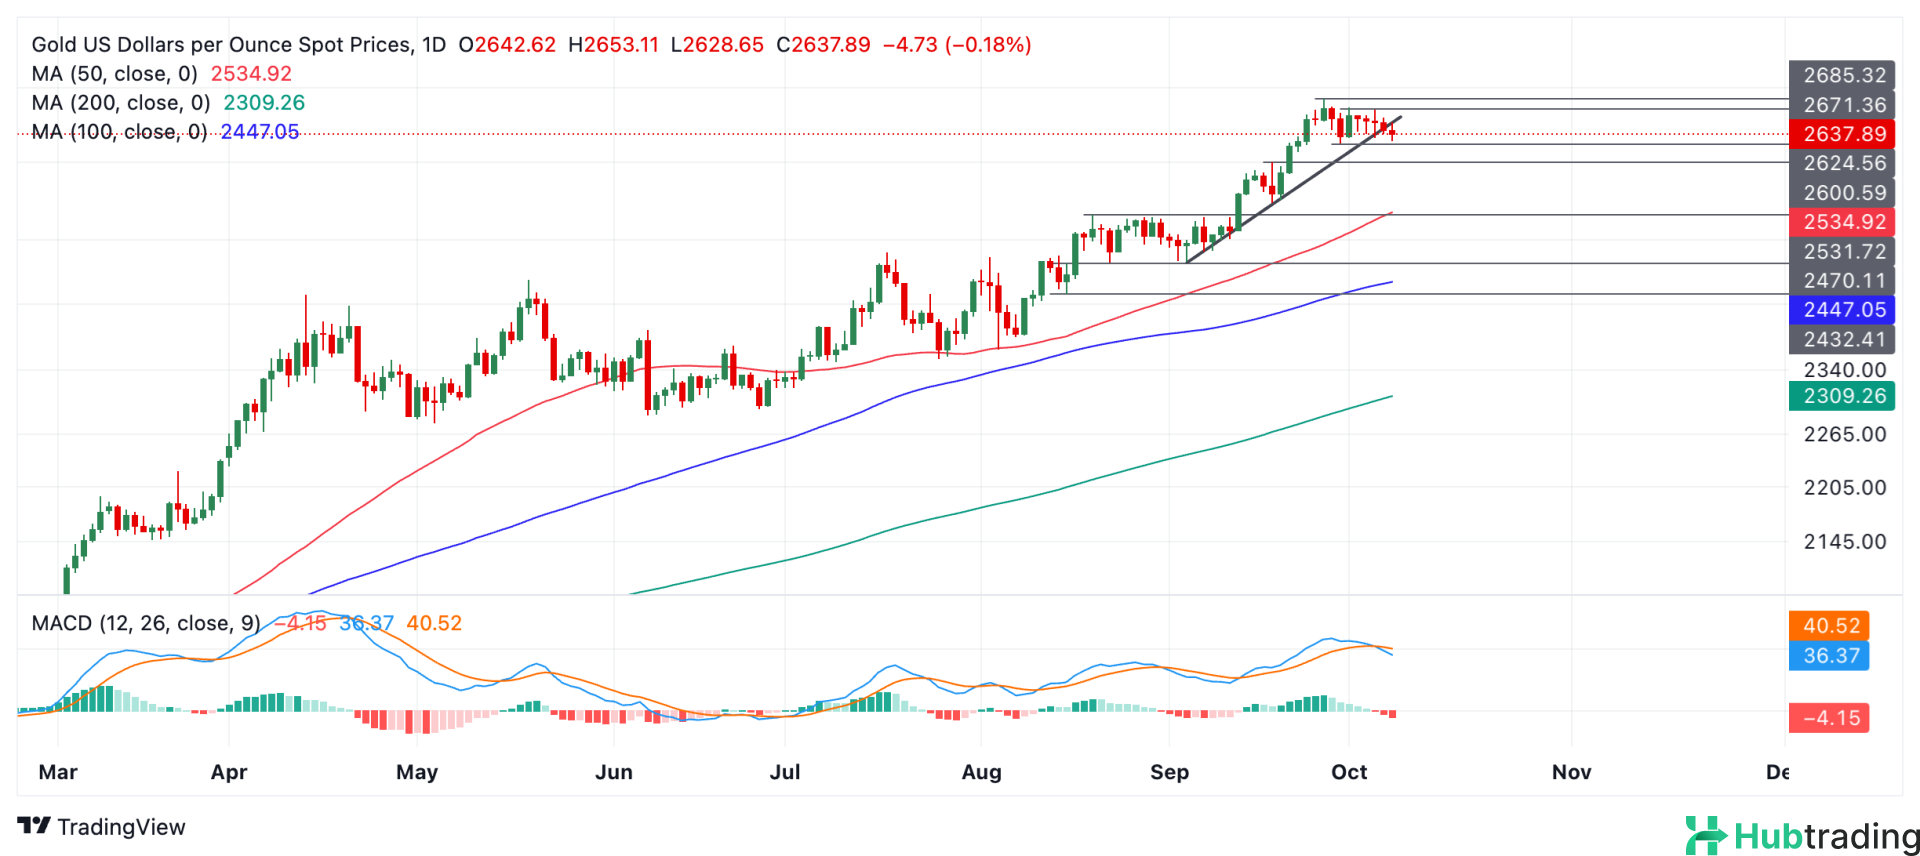
- From a technical perspective, XAU/USD has breached a trendline, continuing its narrow range-bound trading pattern.
Gold (XAU/USD) is trading in the $2,630s on Tuesday, experiencing a slight decline within its recent $50 trading range.
The disappointing fiscal stimulus announcement from China, the world’s largest gold consumer, poses a challenge for gold prices. Additionally, the reduced likelihood of a substantial interest rate cut—specifically, a double-dose 50 basis points (bps) reduction—by the Federal Reserve (Fed) at its upcoming November meeting adds further pressure. With growing expectations that any rate cut will be limited to 25 bps or potentially none at all, the opportunity cost of holding gold, a non-interest-bearing asset, remains higher than anticipated.
Gold Supported by ETF Flows and Safe-Haven Demand
Despite these headwinds, gold is bolstered by robust demand for gold-backed Exchange Traded Funds (ETFs), which allow investors to purchase shares in gold instead of physical bullion. The World Gold Council (WGC) reported that global physically-backed gold ETFs saw an inflow of $2.1 billion in August, extending their streak of gains to four months. This follows July’s record inflow of $3.7 billion, the highest since April 2022.
Gold is also considered an attractive safe-haven asset amid escalating geopolitical tensions. Recent Israeli military actions in Lebanon, following a Hamas bombing, have further heightened these tensions. The deputy leader of Hezbollah remarked on the ongoing conflict, asserting that the group remains capable despite significant losses. Moreover, markets are wary of potential retaliatory actions by Israel against Iran following last week’s ballistic rocket attack.
The overall trend of declining global interest rates, notwithstanding adjustments in the US, provides additional support for gold, enhancing its appeal as a portfolio asset.
Technical Analysis: Gold Tests Trendline
Gold is currently testing a crucial trendline while continuing to trade within a narrow sideways range, characterized by a ceiling around $2,673 (the high from October 1) and a floor at $2,632 (the low from October 4).
XAU/USD Daily Chart

The short-term trend remains sideways, and according to the technical principle that “the trend is your friend,” it is likely to persist with prices oscillating between these two levels.
A breakout above $2,673 would strengthen the possibility of resuming the previous uptrend, potentially reaching the psychological target of $2,700.
Conversely, a break below $2,632 could lead to a decline towards at least the swing low of $2,625 (from September 30). A further drop below this level would likely find support at $2,600, which is a significant round number and aligns with the August 18 high.
Overall, gold maintains a long-term uptrend, with expectations of an eventual resumption of upward movement once the current consolidation phase concludes.
Confirmation of a new directional bias will require a decisive breakout either above the upper range or below the lower range.


