- Gold prices decline for the third consecutive day on Tuesday, driven by continued US Dollar strength.
- Rising US bond yields are further discouraging investment in the non-yielding XAU/USD.
- Traders are awaiting comments from Federal Reserve officials and the US consumer inflation data for new market direction.
Gold prices (XAU/USD) continued their decline during the first half of Tuesday's European session, falling below the $2,600 mark for the first time since September 20. The ongoing strength of the US Dollar, driven by the so-called "Trump trade," remains a key factor putting downward pressure on gold.
The USD surged to its highest level in over four months, fueled by expectations that President-elect Donald Trump’s economic policies, such as tax cuts and increased government spending, could boost US economic growth and inflation. This, in turn, is expected to limit the Federal Reserve’s ability to ease policy aggressively, keeping US Treasury yields elevated and further dampening demand for the non-yielding yellow metal.
Gold Prices Pressured by Strong USD and US Bond Yields
- The US Dollar’s rally following Trump’s election victory continues to weigh on gold, with the Greenback hitting its highest level since early July.
- Trump’s proposed expansionary policies, including corporate tax cuts and fiscal stimulus, are seen as likely to push inflation higher, which would limit the Fed’s scope for further interest rate cuts.
- Minneapolis Fed President Neel Kashkari stated on Sunday that the central bank wants more evidence of inflation returning to its 2% target before considering additional rate cuts.
- Meanwhile, US Treasury bond yields remain elevated, as markets assess the broader implications of Trump’s fiscal policies on growth and inflation. While Trump's 10% tariff proposal on imports could raise concerns about a global trade war, it has also provided some support for gold as a safe-haven asset.
- Traders are now awaiting speeches from key Federal Reserve officials, including Chair Jerome Powell, for clues on the future path of US interest rates.
- The CME Group’s FedWatch tool shows a 65% probability of a 25-basis-point rate cut by the Fed in December, with a 35% chance of no change.
- Additionally, the release of US consumer inflation data and the Producer Price Index (PPI) this week will be closely watched for further guidance on inflation trends and their potential impact on monetary policy.
Technical Outlook for Gold
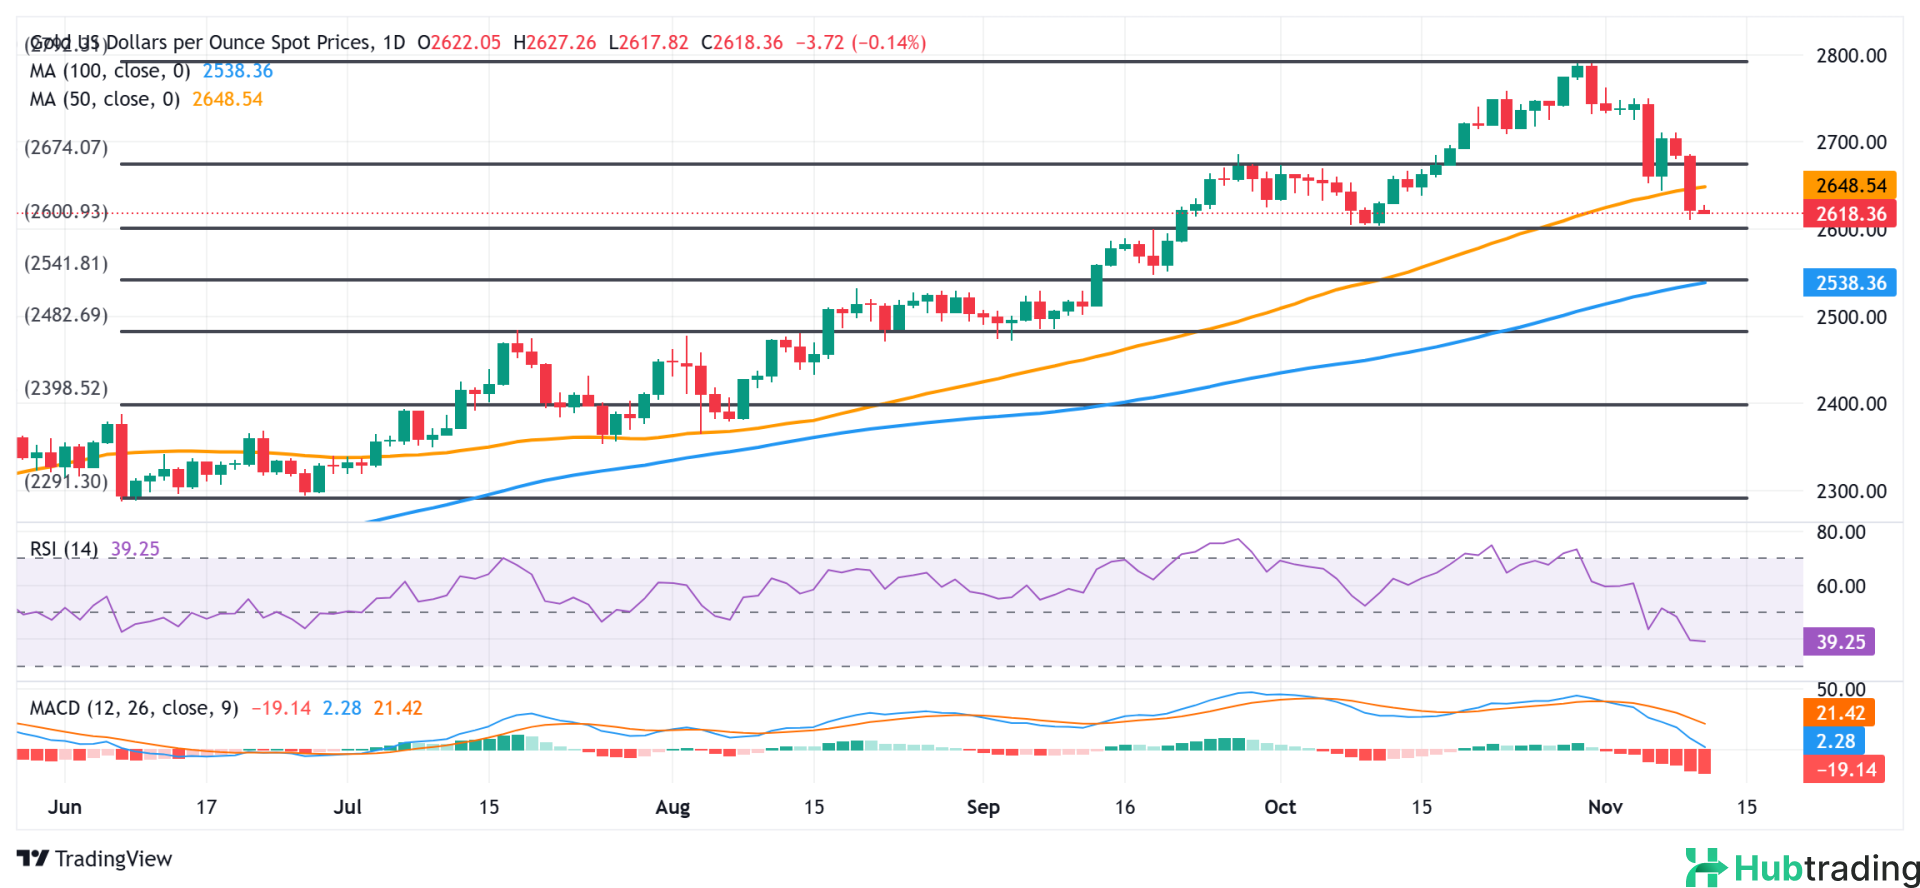
From a technical standpoint, the recent breakdown below the 50-day Simple Moving Average (SMA) has added to the bearish momentum, with oscillators on the daily chart indicating further downside potential.
Gold's decline has stalled near the $2,600 level, which coincides with the 38.2% Fibonacci retracement of the June-October rally. This level could act as a critical support zone. A decisive break below $2,600 would likely trigger a further pullback toward the $2,540-$2,539 area, which includes the 50% Fibonacci level and the 100-day SMA. If this support zone is breached, it would suggest that gold’s rally has likely peaked for the near term.
On the upside, resistance is seen between $2,632 and $2,635. A move above this range could signal a short-covering rally, potentially pushing gold prices back toward $2,659-$2,660. If gold breaks through this level, further gains toward $2,684-$2,685 and eventually the $2,700-$2,710 zone could be in the cards, indicating that the recent correction may be over and bullish sentiment may resume.


