-
Gold prices fall over 1% to around $3,320 as the Israel-Iran ceasefire reduces demand for safe-haven assets.
-
Fed Governor Bowman backs a July rate cut, citing rising risks in the labor market.
-
The US Dollar weakens on easing geopolitical tensions and dovish signals from the Fed.
Gold (XAU/USD) dropped sharply to around $3,320 during the European trading session on Tuesday, pressured by a notable decline in safe-haven demand following the announcement of a ceasefire between Israel and Iran.
U.S. President Donald Trump confirmed the truce via Truth.Social, stating, “The ceasefire is now in effect. Please do not violate it!” The agreement puts an end to 12 days of aerial conflict in the region. However, Israeli Prime Minister Benjamin Netanyahu cautioned that Israel's defense forces would respond forcefully should Iran breach the agreement.
Despite the easing geopolitical tensions weighing on gold, the metal may find support from a shift in the Federal Reserve’s monetary policy tone. In a speech in Prague on Monday, Fed Vice Chair Michelle Bowman acknowledged the growing risks in the labor market and signaled openness to easing policy. She stated, “Should inflation pressures remain contained, I would support lowering the policy rate as soon as our next meeting to bring it closer to its neutral setting and to sustain a healthy labor market.”
A more dovish Fed outlook typically benefits gold, a non-yielding asset, as lower interest rates reduce the opportunity cost of holding it. At the same time, the combination of the ceasefire and dovish Fed commentary has weighed heavily on the U.S. Dollar.
Technical Analysis: Gold Drops Below 20-Day EMA, Near-Term Bias Turns Cautious
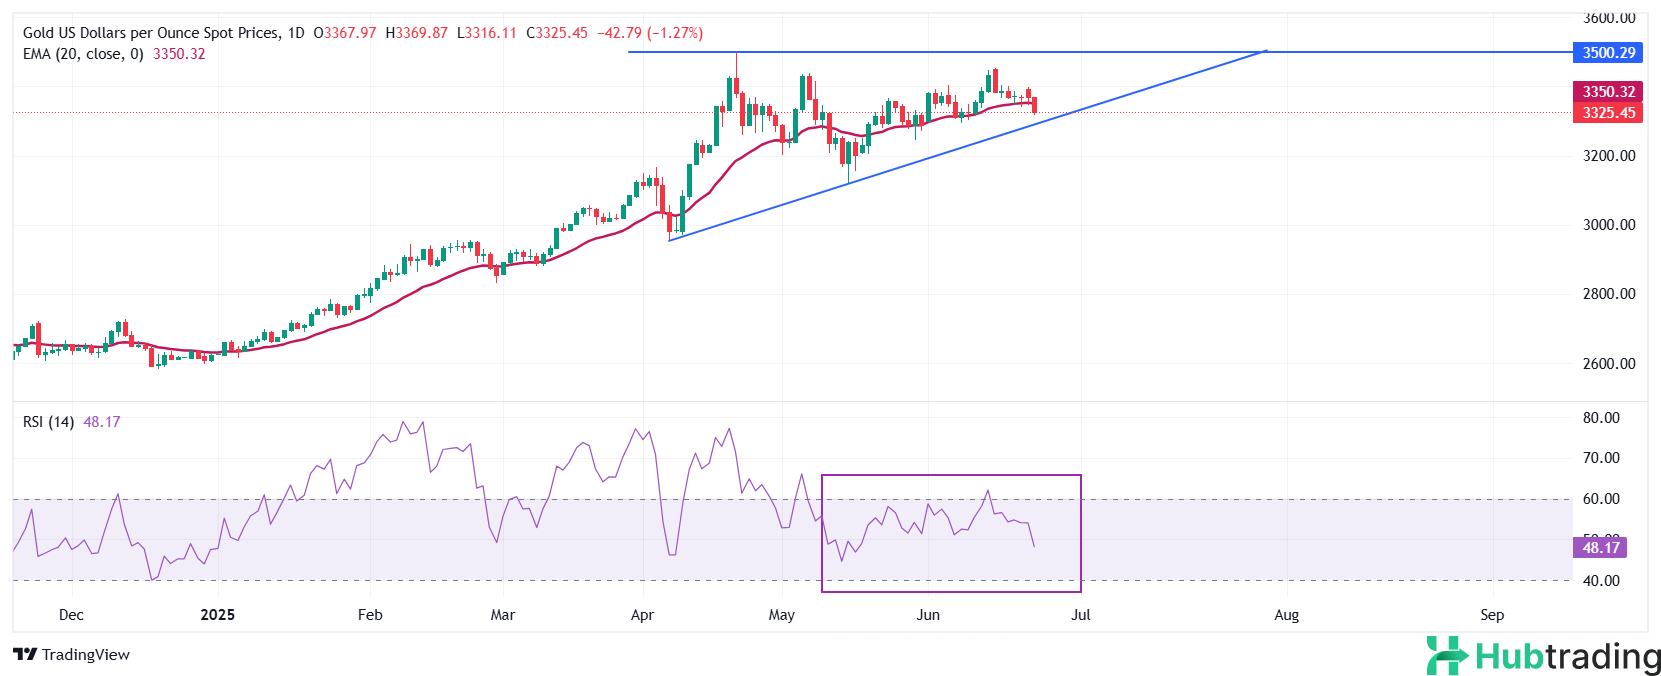
On the daily chart, gold is forming an Ascending Triangle pattern, signaling potential price compression before a breakout. The horizontal resistance is anchored around the April 22 high near $3,500, while the rising trendline originates from the April 7 low at $2,957.
Gold has now slipped below its 20-day Exponential Moving Average (EMA), indicating a weakening of near-term bullish momentum. The 14-day Relative Strength Index (RSI) has also fallen below 50, reinforcing a shift toward bearish sentiment.
Key Levels to Watch:
Upside Resistance:
- $3,500 (psychological barrier)
- $3,550
-
$3,600
Downside Support:
- $3,245 (May 29 low)
- $3,200 (round-number support)
- $3,121 (May 15 low)
A decisive move above $3,500 would open the door to uncharted territory, while a break below $3,245 could lead to further declines toward $3,200 and $3,121.


