-
Gold ticks upward as ongoing trade tensions and strong safe-haven demand support prices.
-
Upcoming US-China trade talks on Monday remain a key driver for both Gold and the US Dollar.
-
Gold climbs above $3,300, with immediate resistance seen near the $3,350 level.
Gold prices remained elevated on Monday, despite the start of US-China trade negotiations in London. The metal continues to benefit from safe-haven demand, driven by broader geopolitical tensions—particularly the intensifying conflict between Ukraine and Russia over the weekend. This comes alongside persistent economic friction, such as the United States’ imposition of 50% tariffs on steel and aluminum imports.
Gold Daily Outlook: Will US-China Trade Talks Boost Safe-Haven Demand?
- Last Friday’s stronger-than-expected US Nonfarm Payrolls (NFP) report eased immediate concerns over potential interest rate cuts by the Federal Reserve, weighing slightly on gold's bullish case.
- Nevertheless, geopolitical uncertainty remains a key support for gold, reinforcing its role as a safe-haven asset.
- International backlash against US trade measures has also added to market caution. On Thursday, Reuters reported that the Canadian Prime Minister labeled the tariffs as “illegal,” while Mexico and the European Union echoed similar sentiments. Mexican President Claudia Sheinbaum criticized the new tariffs as "unjust, unsustainable, and without legal grounds," warning of possible retaliatory measures.
- Both Canada and the EU have also threatened countermeasures if trade negotiations stall this week.
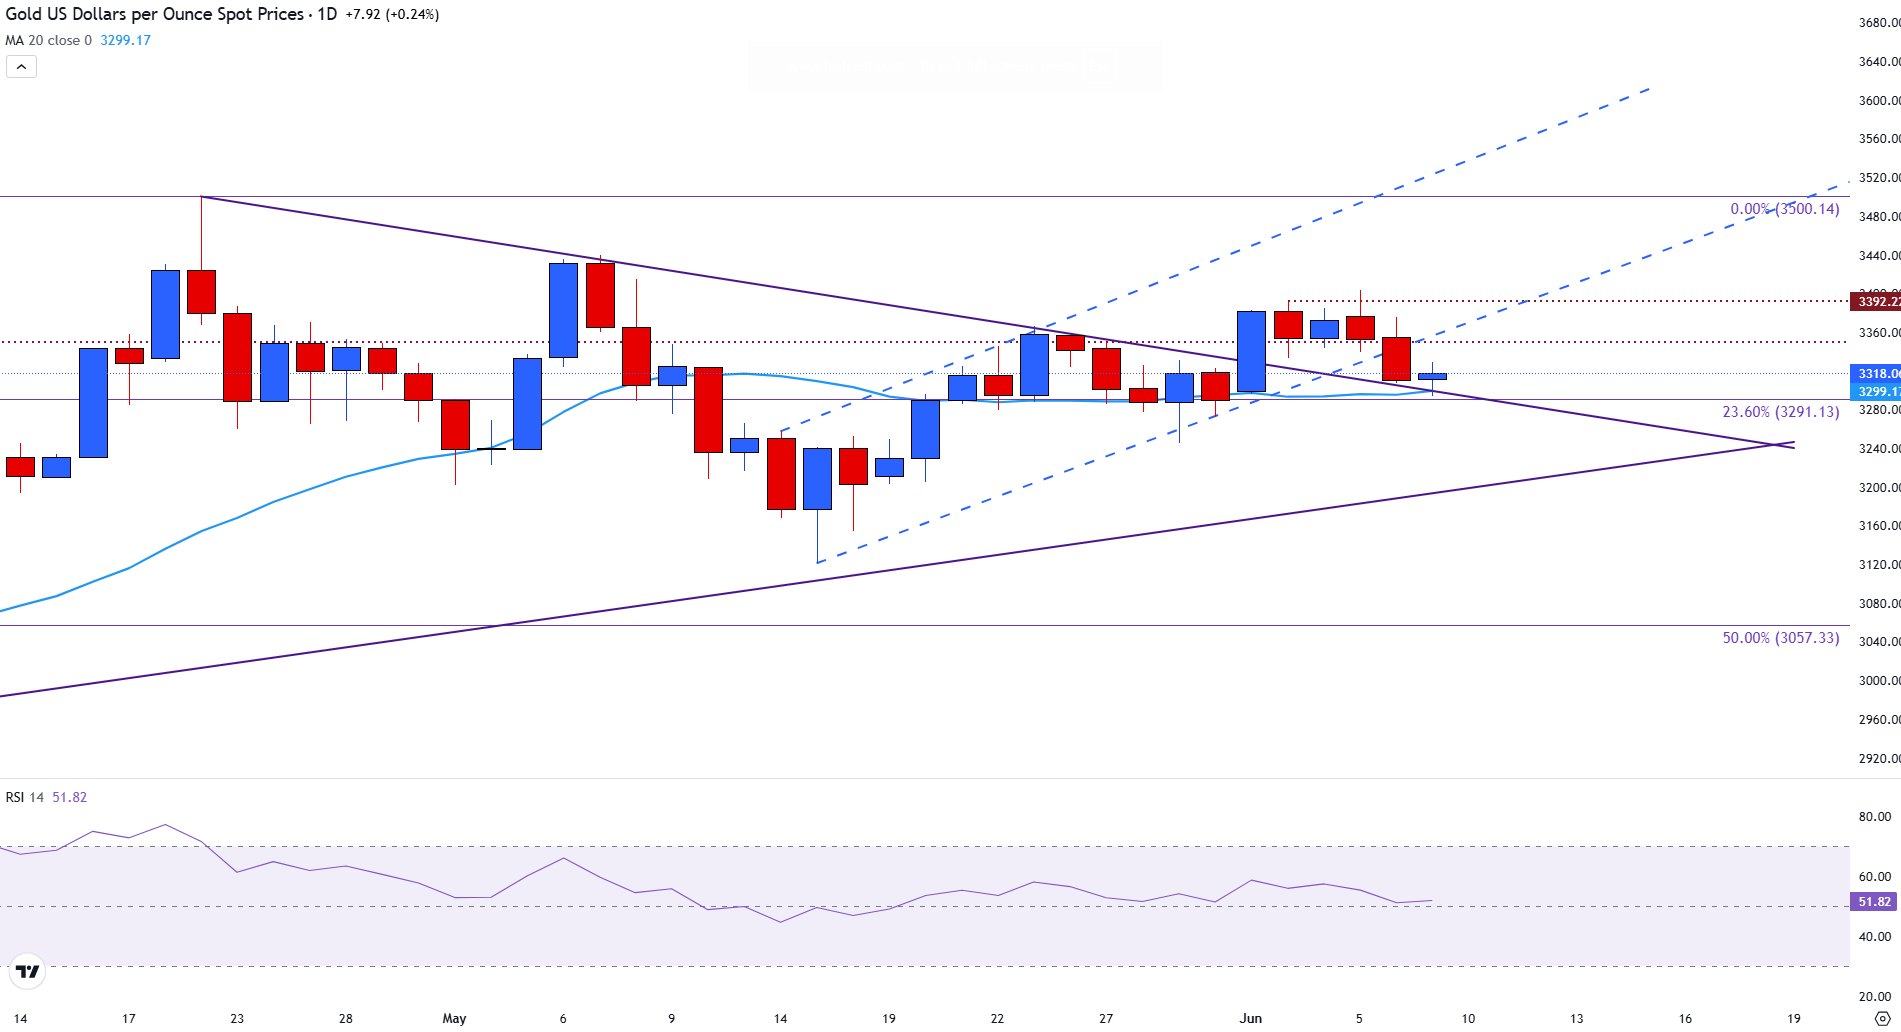
From a technical perspective, gold prices pulled back on Monday, retreating from last week’s highs. The metal failed to maintain levels above the $3,339–$3,392 resistance range and has since dropped below the short-term support near $3,320. Prices are now testing a key level at $3,291, which corresponds to the 23.6% Fibonacci retracement. A daily close below this level could signal increased bearish pressure.
Currently, gold's price action is contained within a symmetrical triangle, indicating market indecision. The lower edge of this formation is being tested, and a confirmed breakdown may lead to further losses toward ascending trendline support in the $3,250–$3,260 zone. If this level fails to hold, deeper downside potential exists toward the 50% Fibonacci retracement at $3,057, an area of previous structural support.
On the upside, a rebound would need to break convincingly above the $3,339–$3,392 resistance zone to reestablish bullish momentum. A successful breakout could set the stage for a move toward the $3,500 mark—a key medium-term target for bullish traders. However, the 20-day Simple Moving Average (SMA) has flattened near $3,299, reflecting waning momentum.
Momentum indicators align with this neutral outlook. The Relative Strength Index (RSI) is hovering around 52, indicating a lack of strong directional bias and suggesting further consolidation is likely unless a significant catalyst emerges—such as shifts in US interest rate policy or major geopolitical developments.
In summary, gold’s technical outlook has weakened following Friday’s breakdown below short-term support. A decisive daily close below $3,291 could tilt the near-term bias to bearish. However, holding the base of the triangle pattern could still offer room for recovery toward resistance if fresh catalysts support the bulls.
Gold daily chart