- Gold stabilizes after a steep over-3% sell-off triggered by news of a ceasefire deal between Israel and Hezbollah.
- The Israeli war cabinet convenes on Tuesday to discuss the 60-day ceasefire, while Trump threatens tariffs on neighbors and China.
- Technically, XAU/USD forms a Bearish Engulfing candlestick pattern as it tests support at a key trendline.
Gold (XAU/USD) stabilizes in the $2,630s on Tuesday after a significant sell-off of over 3% on Monday, falling by more than $90. The sharp decline was triggered by rumors that Israel and Hezbollah were nearing a ceasefire agreement, which reduced geopolitical risk and diminished the safe-haven demand for gold.
While the ceasefire would benefit Lebanon, it lessened the appeal of gold as investors moved away from safe-haven assets.
Gold's sell-off pauses on Tuesday as Trump threatens tariffs on neighboring countries
On Tuesday, gold initially weakened further after President-elect Donald Trump threatened to impose 25% trade tariffs on Mexico and Canada, with an additional 10% tariff on China.
Trump’s remarks, aimed at tightening borders and addressing illegal immigration and drug trafficking, led to a stronger US Dollar (USD), which typically moves inversely to gold. However, gold has since recovered some of its losses as the session progressed.
Gold drops as a ceasefire deal nears
The sell-off in gold began on Monday after reports emerged suggesting that Israel and Hezbollah were close to agreeing on a ceasefire deal in Lebanon. The potential ceasefire, if implemented, would involve the Israeli army withdrawing its forces from Lebanon in exchange for Hezbollah pulling back from areas near the northern Israeli border.
However, the ceasefire would not extend to Gaza. Despite these negotiations, the Israeli Defense Forces (IDF) continued to engage in military actions, killing at least 31 people in Lebanon, 11 in Gaza, and two on the Syrian border in recent attacks.
Technical Analysis: XAU/USD pulls back to major trendline
Gold’s price action has seen a notable pullback. The price sliced through the 50-day Simple Moving Average (SMA) at around $2,666, dropping to test a key trendline near $2,630, which marks the long-term uptrend for gold.
The bearish price movement formed a Bearish Engulfing candlestick pattern on Monday. If this pattern is confirmed by further downside on Tuesday, it could signal a short-term reversal and more bearish pressure for gold.
XAU/USD Daily Chart
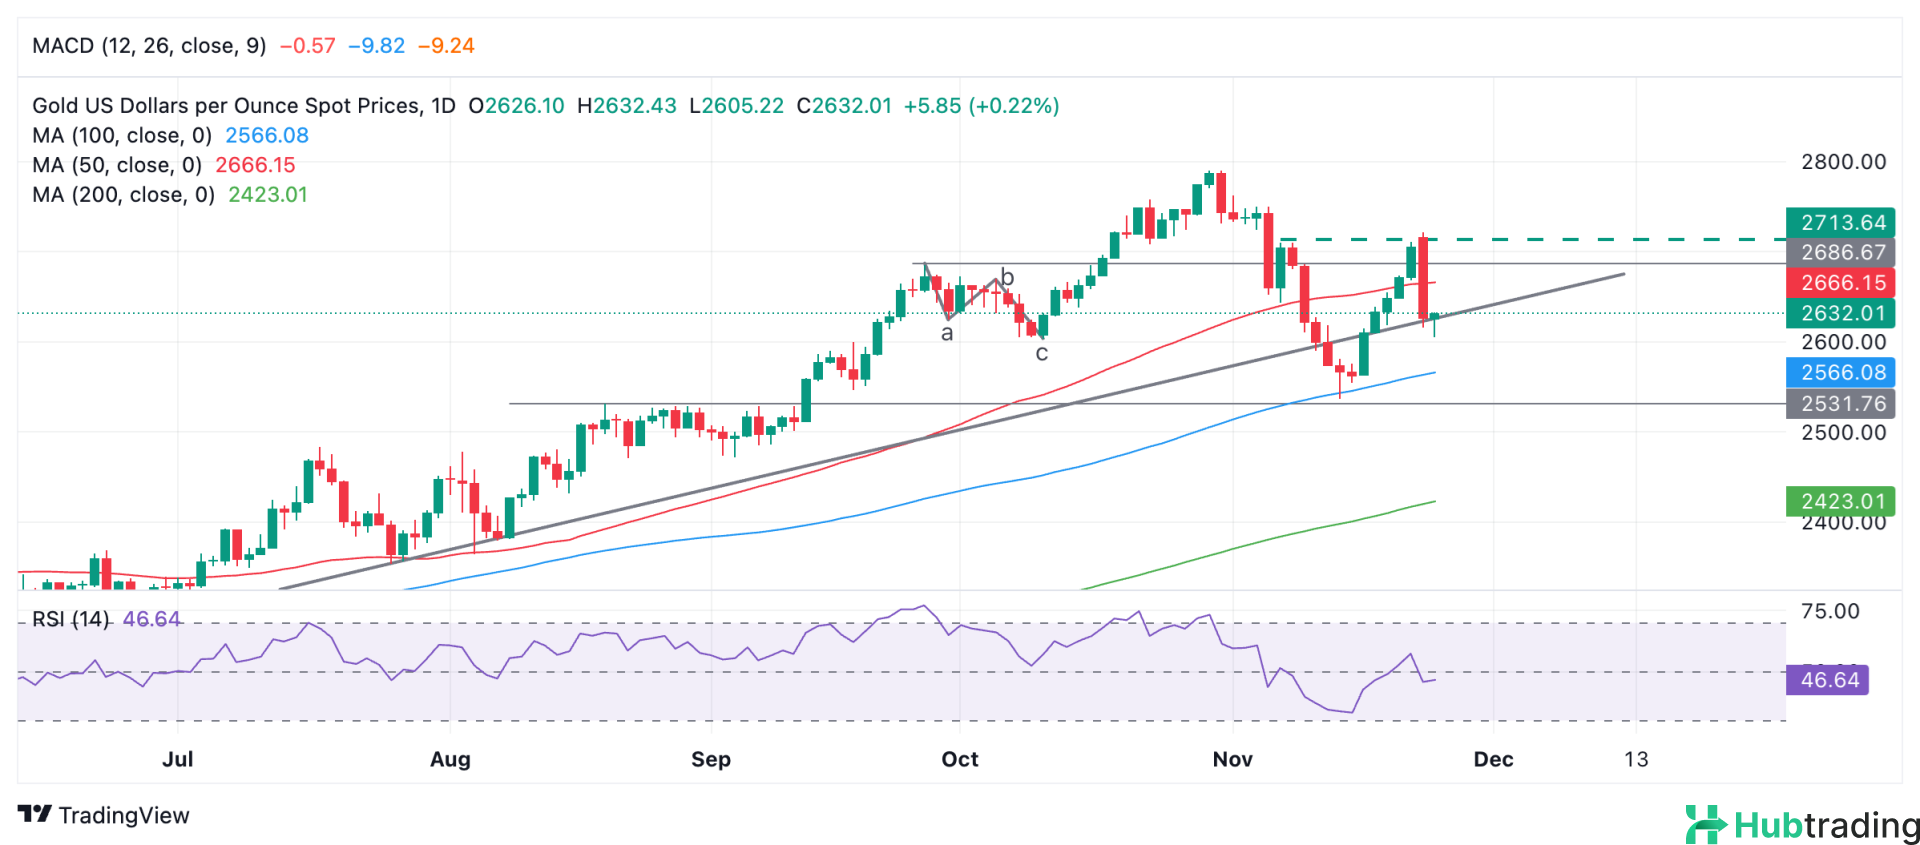
Despite the short-term weakness, the overall medium and long-term trend for gold remains bullish. A break above Monday's high of $2,721 would be a bullish signal, suggesting that the uptrend could continue, with the next target around $2,790, which matches gold’s previous record high.
On the other hand, if the price breaks decisively below the major trendline, it would likely trigger further losses and could flip the short-term trend to bearish. A confirmation of this bearish move would require a strong red candlestick breaking the trendline, or three consecutive red candles closing below the trendline.


