- NZD/JPY continues its downtrend, slipping below key support levels.
- Technical indicators point to additional downside potential.
- The broader outlook shows the pair trapped in a sideways trading range.
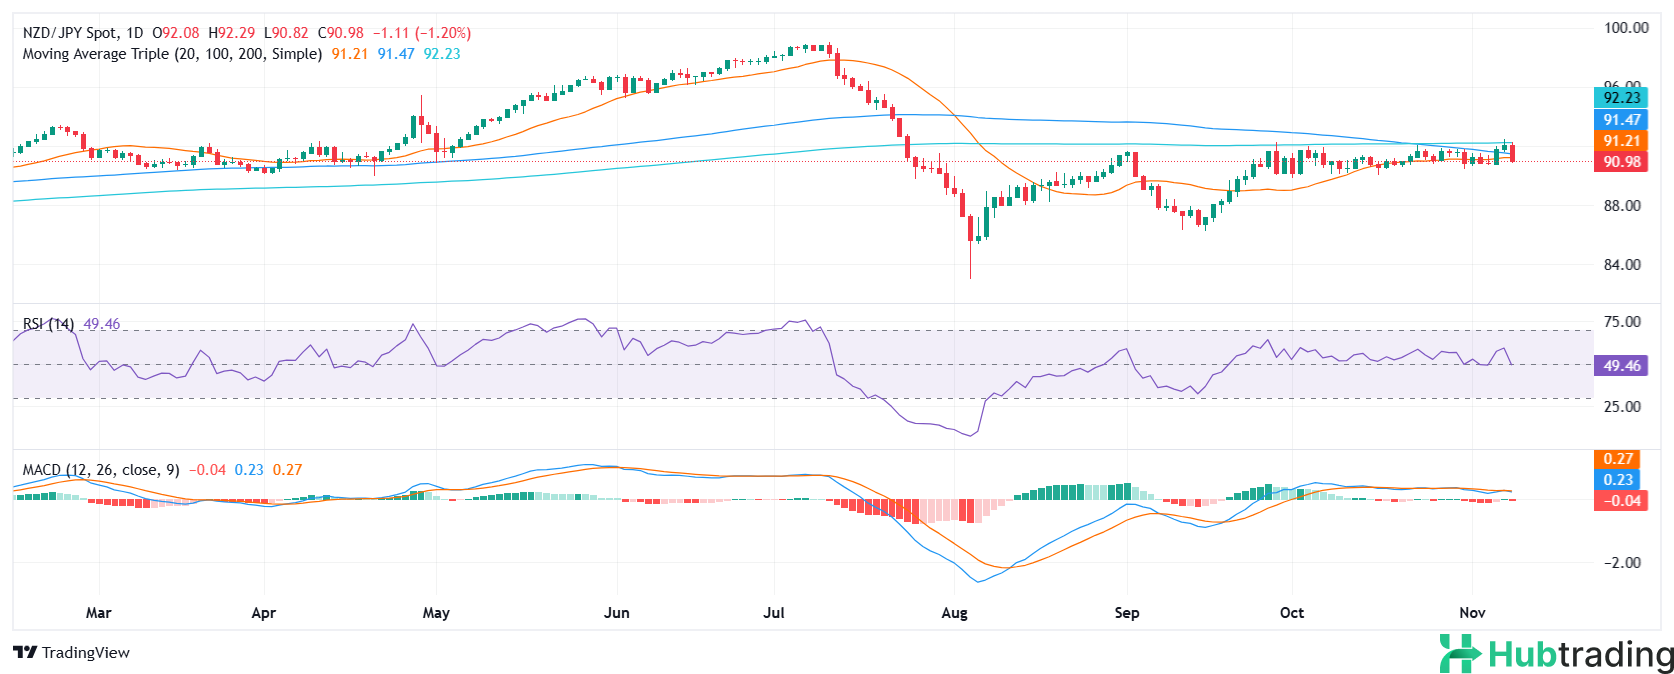
On Friday, the NZD/JPY dropped by 1.20% to 91.00, extending its bearish momentum. The pair’s breakdown below the key 91.00 support level, coupled with the convergence of the 20-day and 100-day Simple Moving Averages (SMAs), further confirms the strength of the selling pressure.
Technical indicators point to a continued bearish outlook. The Relative Strength Index (RSI) has fallen into negative territory and is sharply declining, signaling increasing selling pressure. The Moving Average Convergence Divergence (MACD) also shows rising bearish momentum, with the histogram in red and expanding.
Given these factors, the NZD/JPY pair is likely to maintain its downward trajectory. Immediate support levels to watch are 90.80, followed by 90.50 and 90.30. On the upside, resistance is seen at 91.50, then 91.80, and 92.00.
NZD/JPY Daily Chart