- The NZD/USD has faced rejection at the 20-day SMA for the fourth time this week.
- Technical indicators suggest growing selling pressure and weakening buying momentum.
- A breakout below the 0.5940-0.6030 range would confirm a bearish outlook.
On Friday, the NZD/USD dropped by 1.05% to 0.5960, continuing its downward trajectory after facing rejection for the third time this week at the 20-day Simple Moving Average (SMA).
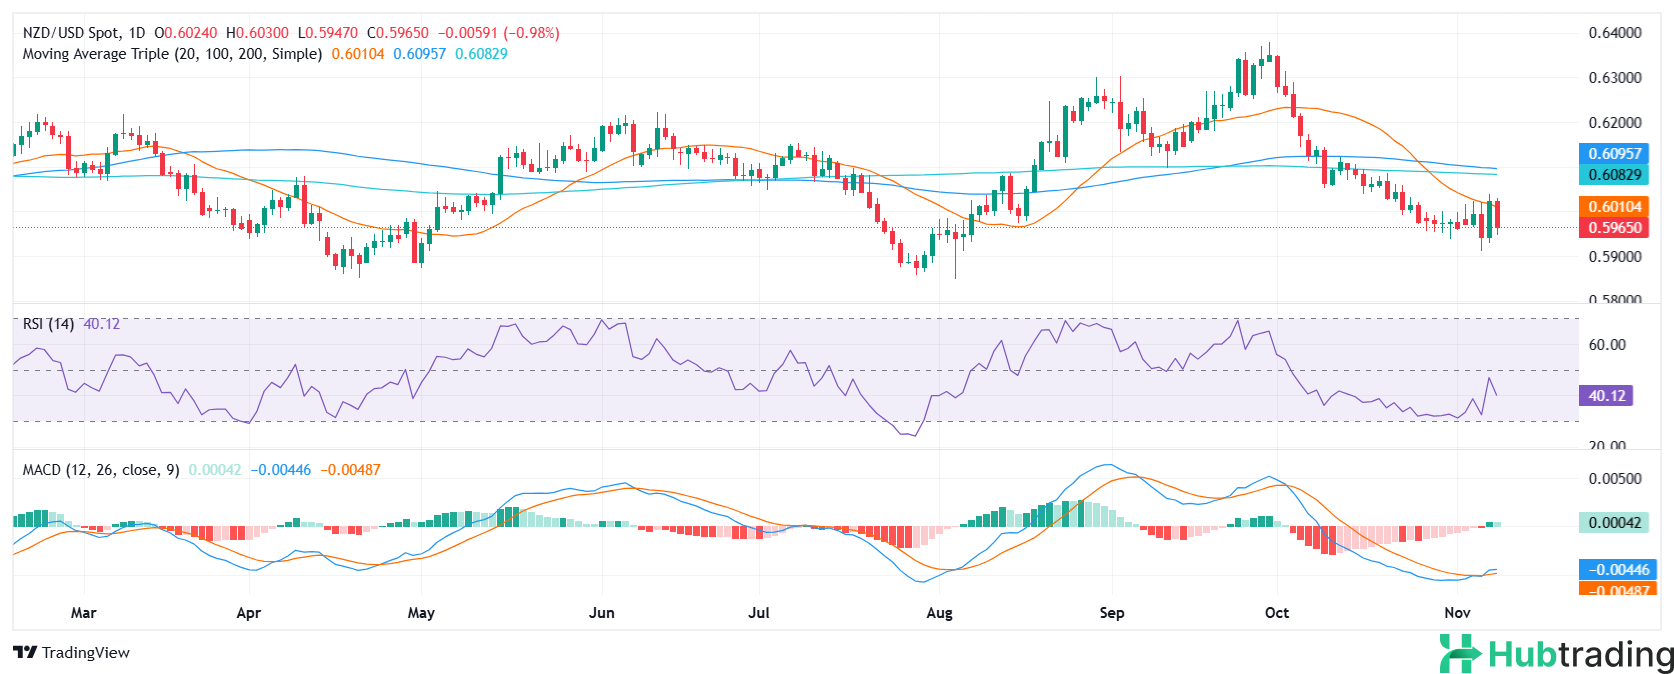
The Relative Strength Index (RSI) is currently at 40, in negative territory, signaling increasing selling pressure. The sharp decline in the RSI slope reinforces the growing bearish momentum. Meanwhile, the Moving Average Convergence Divergence (MACD) presents a mixed outlook: while the histogram remains green, it is shrinking, suggesting that buying pressure is waning.
The NZD/USD encountered its third rejection from the 20-day Simple Moving Average (SMA), signaling robust selling pressure. This latest rejection has driven the pair lower, reinforcing the likelihood of a continued downtrend. The repeated failures to break above the 20-day SMA emphasize the strength of the resistance and the inability of buyers to gain traction. As a result, further downside momentum is expected in the near term.
NZD/USD Daily Chart