-
NZD/USD may encounter the next resistance at the six-month high of 0.6038.
-
A break above the 14-day RSI level of 70 could indicate overbought conditions, increasing the risk of a pullback.
-
A drop below the nine-day EMA at 0.5870 could weaken the short-term bullish momentum.
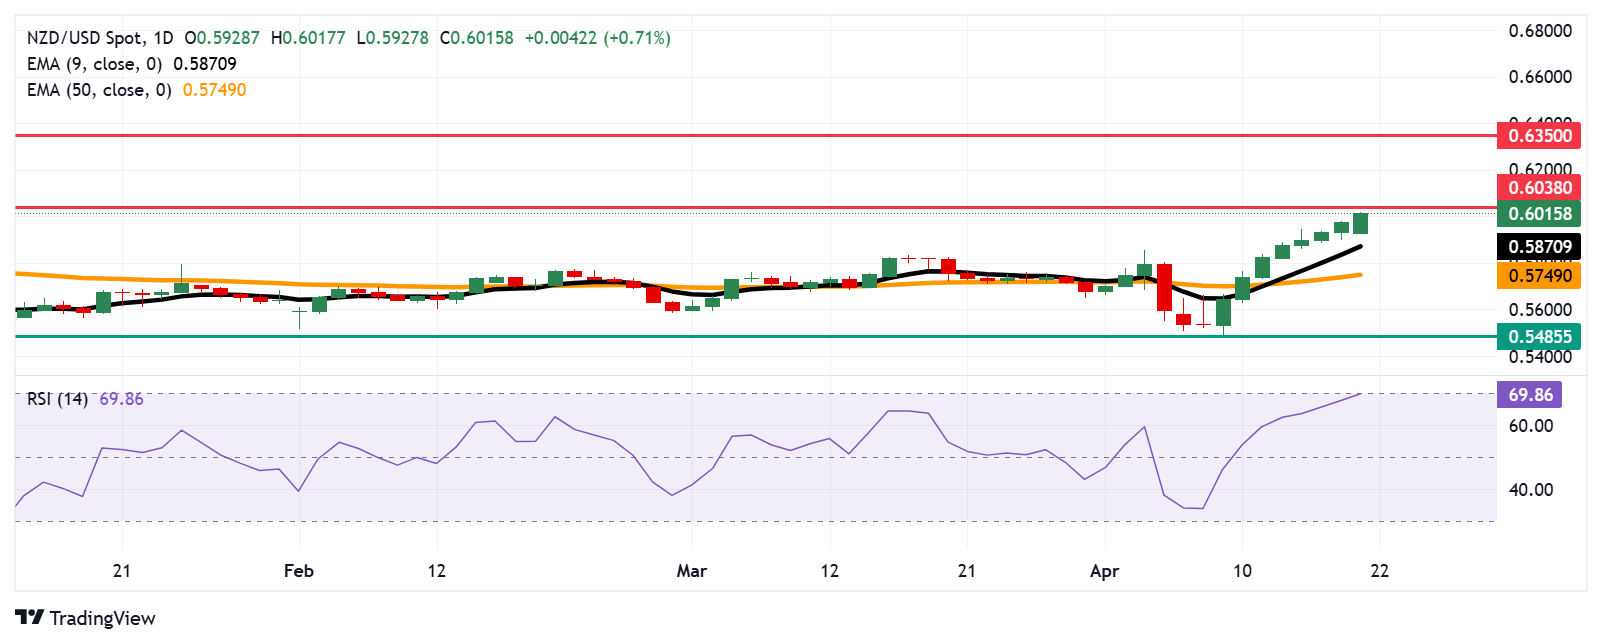
The NZD/USD pair continues its upward momentum, extending the winning streak that began on April 9, trading around 0.6010 during early European hours on Thursday. Technical indicators on the daily chart signal a bullish outlook, with the pair maintaining its position above the nine-day Exponential Moving Average (EMA). The 14-day Relative Strength Index (RSI) is nearing the 70 level, supporting the ongoing bullish trend. However, a break above the 70 level could indicate overbought conditions and heighten the risk of a pullback. The nine-day EMA has crossed above the 50-day EMA, reinforcing the overall bullish trend and suggesting further potential for gains.
To the upside, NZD/USD faces key resistance at the six-month high of 0.6038, last reached in November 2024. A breakout above this level would likely reinforce the bullish outlook, paving the way for a potential move towards the seven-month high near 0.6350 from October 2024.
On the downside, the primary support is located at the nine-day EMA around 0.5870. A break below this level could weaken the short-term bullish momentum, exposing NZD/USD to further downside toward the 50-day EMA at 0.5748. Additional support is found at 0.5485, a level not seen since March 2020.
NZD/USD: Daily Chart