-
NZD/USD could test the psychological resistance at 0.5950, with potential to extend toward the six-month high of 0.6038.
-
The 14-day RSI holding above 50 suggests a continued bullish outlook.
-
A clear break below the nine-day EMA may weaken the short-term bullish momentum.
The NZD/USD pair continues its decline for the second consecutive session, trading around 0.5920 during early European hours on Wednesday.
Technical indicators on the daily chart indicate a neutral short-term bias, with the pair hovering around the nine-day Exponential Moving Average (EMA). A clearer directional trend may emerge with further movement.
However, the 14-day Relative Strength Index (RSI) remains above the 50 mark, maintaining a bullish bias. A rise in the RSI toward the 70 level could reinforce the positive market sentiment.
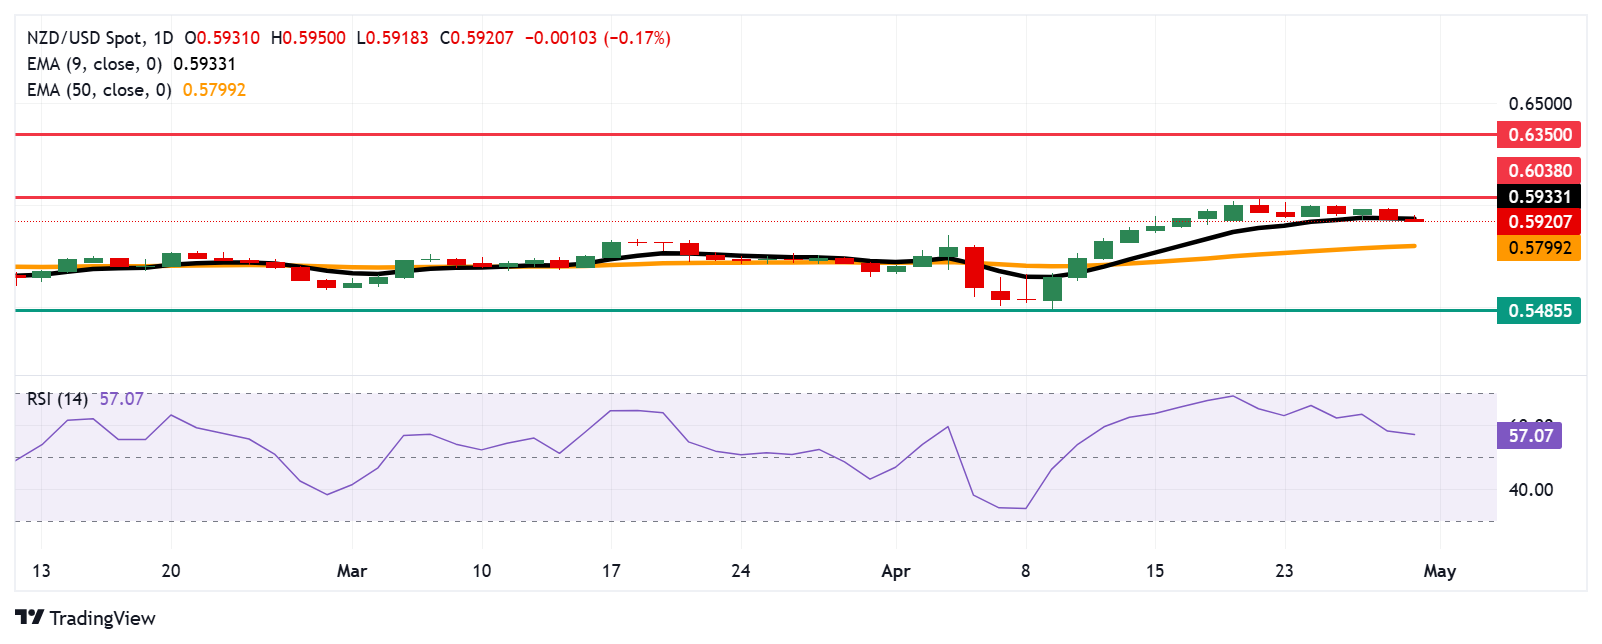
On the upside, the immediate resistance is at the psychological level of 0.5950. Additional resistance is found at the six-month high of 0.6038, last reached in November 2024. A sustained break above this level could pave the way for a test of the seven-month high around 0.6350, recorded in October 2024.
A decisive break below the nine-day EMA would likely weaken the short-term bullish momentum, potentially pushing the price toward the 50-day EMA at 0.5799.
Further downside could deepen the bearish outlook, with the NZD/USD pair possibly testing the support level at 0.5485, a low not seen since March 2020.
NZD/USD: Daily Chart