- NZD/USD is striving to stay within the descending channel pattern.
- A drop of the 14-day RSI below the 30 level would signal oversold conditions, suggesting a potential short-term upward correction.
- Immediate resistance is seen at the nine-day EMA around 0.6101, followed by the 50-day EMA at 0.6153.
The NZD/USD continues its decline for the fourth consecutive day, trading around 0.6050 during Thursday's European session. Analysis of the daily chart indicates that the pair is attempting to stay within the descending channel pattern, signaling a continuation of the bearish trend.
The 14-day Relative Strength Index (RSI) is approaching the 30 level, reinforcing the bearish sentiment. A drop below this threshold would suggest that the NZD/USD is oversold, potentially leading to a short-term upward correction. Additionally, the nine-day Exponential Moving Average (EMA) remains below the 50-day EMA, indicating weakness in the short-term price trend.
In terms of support, if the NZD/USD successfully re-enters the descending channel, it may test the lower boundary around the 0.5880 level, followed by "pullback support" near 0.5850.
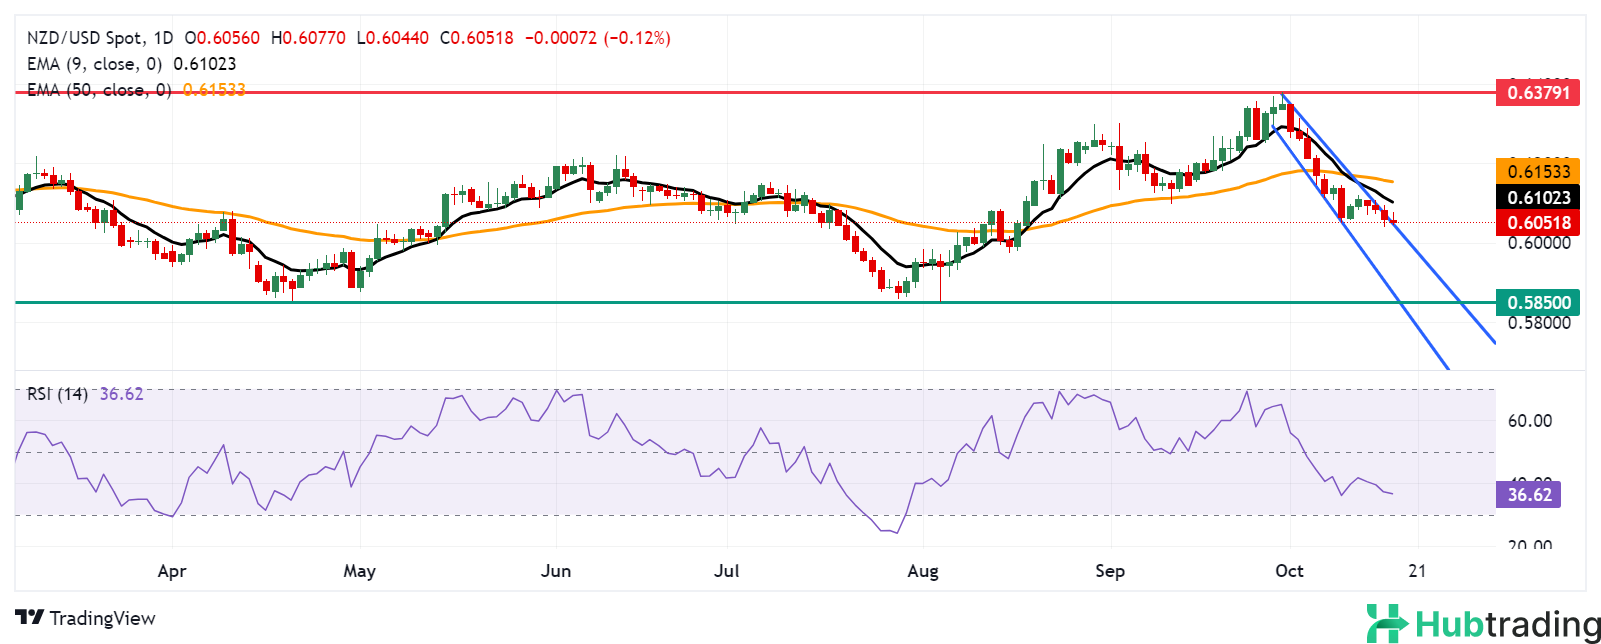
On the upside, immediate resistance is found at the nine-day EMA around 0.6102, followed by the 50-day EMA at 0.6153. A breakout above these levels could shift the outlook to bullish, potentially allowing the NZD/USD to target the 16-month high of 0.6379, last reached on September 30.
NZD/USD: Daily Chart