- NZD/USD challenges immediate resistance at the nine-day EMA of 0.5654.
- The 14-day RSI remains below 50, indicating a prevailing bearish bias.
- A decisive break below 0.5650 could push the pair toward the rectangle’s lower boundary at 0.5550.
The NZD/USD pair snaps a three-day losing streak, trading around 0.5650 during early European hours on Tuesday. The daily chart analysis suggests that buyers and sellers remain uncertain about the asset’s long-term direction, with the pair consolidating within a rectangular pattern.
The 14-day Relative Strength Index (RSI) sits slightly below the 50 level, indicating a prevailing bearish bias. Additionally, the pair remains just under the nine-day Exponential Moving Average (EMA), signaling weak short-term momentum.
NZD/USD: Daily Chart
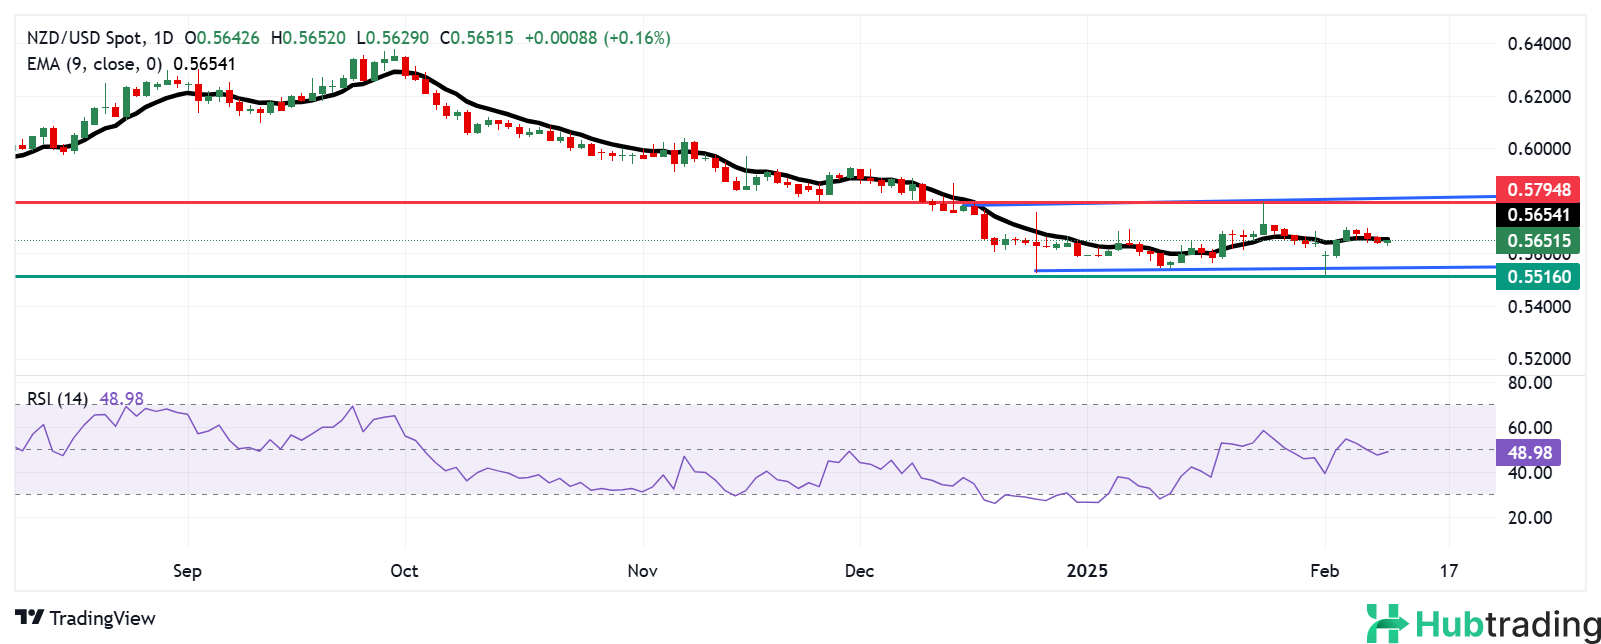
Support Levels
- 0.5650: Crucial support level currently being tested.
- 0.5550: Lower boundary of the rectangle, a potential downside target if 0.5650 breaks.
- 0.5516: February 3 low and the weakest level since October 2022.
A decisive break below 0.5650 could accelerate downside movement toward these support areas.
Resistance Levels
- 0.5654: Nine-day EMA, a key hurdle for short-term price recovery.
- 0.5794: Nine-week high from January 24, a critical resistance point.
- 0.5800-0.5810: Psychological resistance and upper boundary of the rectangle.
A sustained move above the nine-day EMA could boost short-term bullish momentum, with further gains targeting the 0.5794 level and beyond.
NZD/USD remains range-bound, with 0.5650 acting as a key pivot level. A break below this threshold could trigger a decline toward 0.5550, while a move above 0.5654 could open the door for a test of 0.5794. Market participants should watch for directional cues from upcoming economic data and broader risk sentiment.


