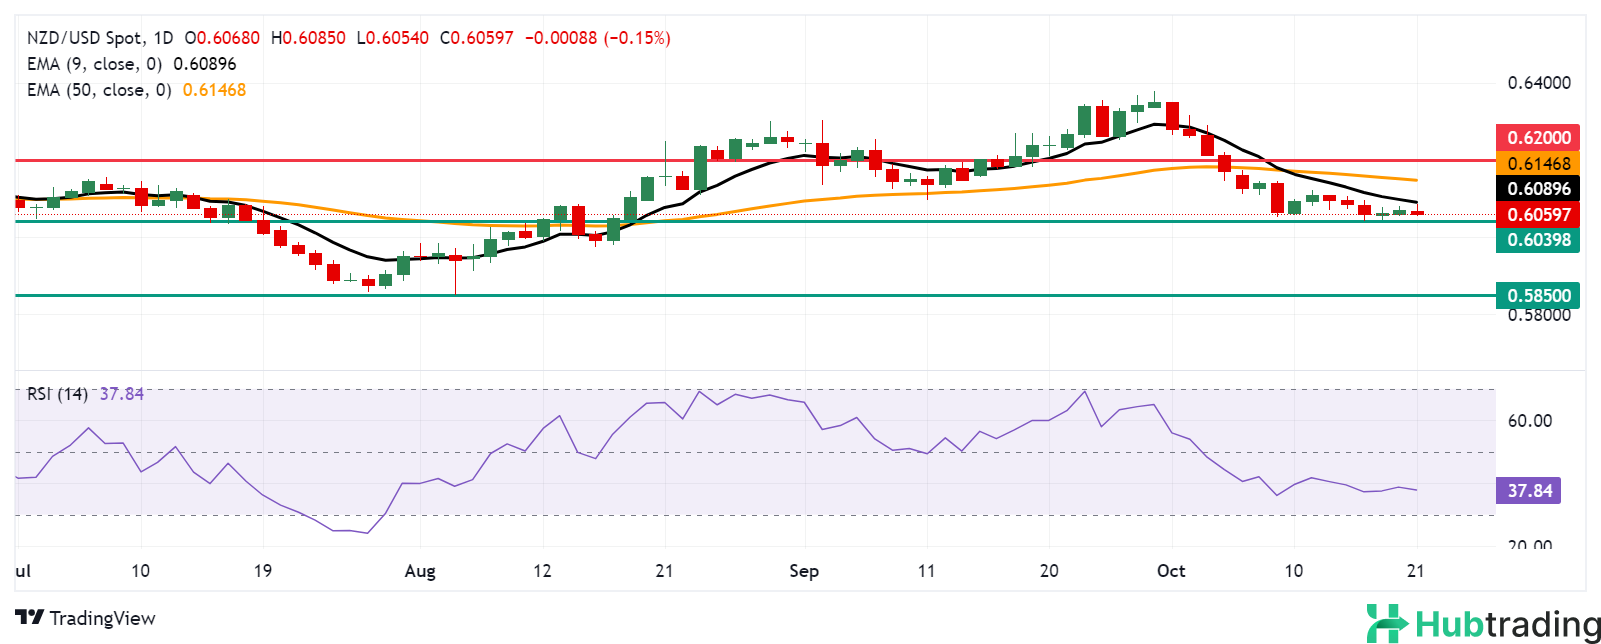
- NZD/USD may approach immediate support at the two-month low of 0.6039.
- Daily chart analysis indicates a short-term bearish bias for the pair.
- A break above the immediate resistance provided by the nine-day and 50-day EMAs could signal a shift toward a bullish outlook.
The NZD/USD pair is losing ground after two days of gains, currently trading around 0.6060 during Monday’s European session. Daily chart analysis indicates that the pair remains below the nine-day Exponential Moving Average (EMA), suggesting a bearish short-term market bias.
Additionally, the 14-day Relative Strength Index (RSI) is consolidating below the 30 level, further reinforcing the bearish sentiment. The nine-day EMA is also positioned below the 50-day EMA, highlighting weakness in the short-term price trend.
On the downside, NZD/USD is testing immediate support near the two-month low of 0.6039, recorded on October 16. Below this, the psychological level of 0.6000 could come into play. A break beneath this level might increase downward pressure, potentially re-testing the "pullback support" area around 0.5850.
In terms of resistance, immediate resistance is seen at the nine-day EMA around 0.6089, followed by the 50-day EMA at 0.6146. A breakout above this level could shift the short-term bias to bullish, allowing the NZD/USD pair to target the psychological level of 0.6200.
NZD/USD: Daily Chart


