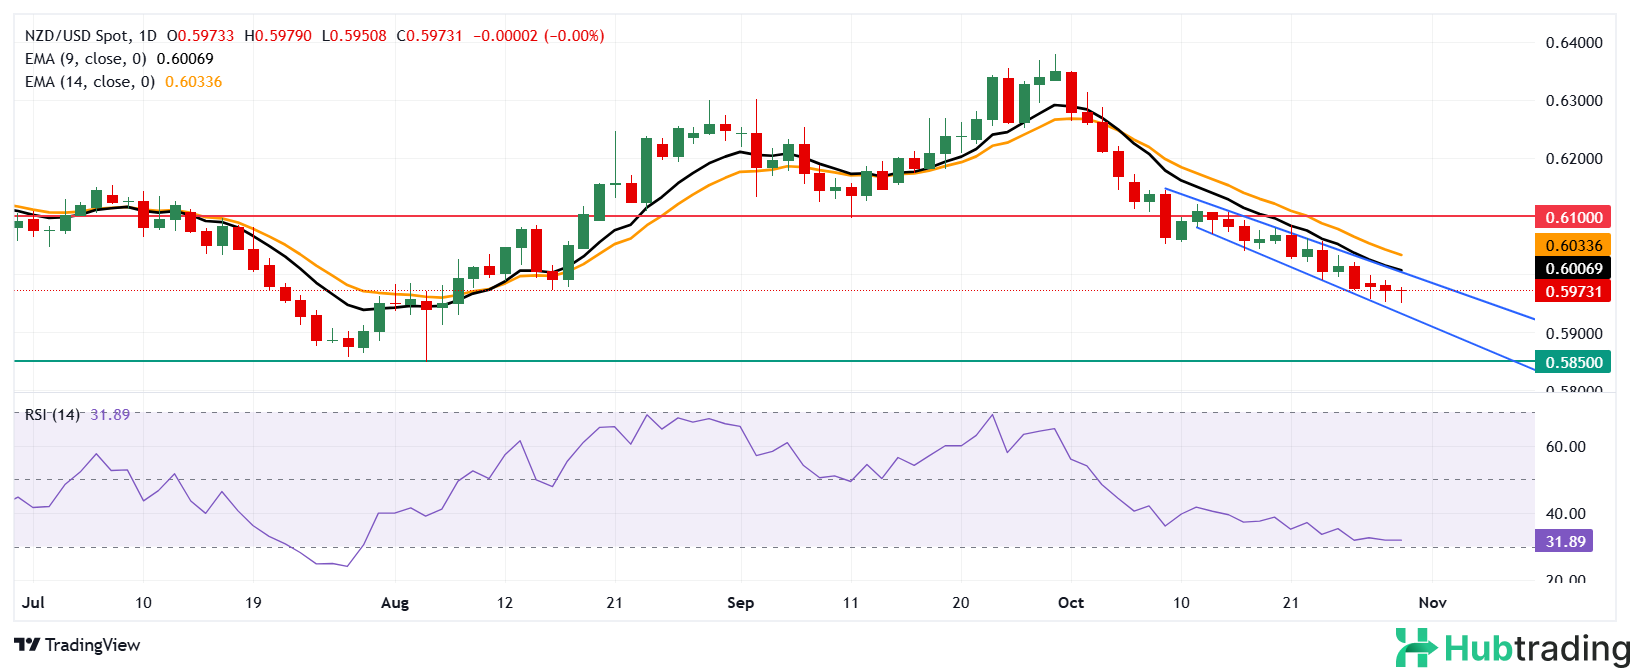
The NZD/USD pair remains subdued for the fourth consecutive session, trading near 0.5970 in Wednesday's European session. The daily chart reveals a downward trajectory within a descending channel, emphasizing a bearish outlook.
Supporting this bias, the nine-day Exponential Moving Average (EMA) stays below the 14-day EMA, signaling persistent bearish momentum for the pair. Short-term momentum appears weak, indicating sustained downward pressure.
The 14-day Relative Strength Index (RSI), a key indicator of momentum, is hovering just above 30. A decline below this level would suggest an oversold condition, potentially hinting at an impending upward correction for the NZD/USD pair.
On the downside, the pair may target the lower boundary of the descending channel near 0.5930. A decisive break below this support could open the way toward "pullback support" around 0.5850.
For resistance, the first hurdle lies at the upper boundary of the descending channel, close to the nine-day EMA near 0.6006, followed by the 14-day EMA at 0.6033. A sustained move above these EMAs could shift the pair to a short-term bullish outlook, with potential to reach the psychological level of 0.6100.
NZD/USD: Daily Chart
![]()