- NZD/USD remains in a consolidation phase, trading within a defined rectangular pattern.
- A bullish breakout could be confirmed if the 9-day EMA crosses above the 50-day EMA.
- Key support levels are found at the 50-day EMA (0.5697) and the 9-day EMA (0.5696).
The NZD/USD pair holds its gains, recovering from daily losses and trading around 0.5710 during European trading hours on Tuesday. Technical analysis of the daily chart suggests a consolidation phase, with the pair moving within a rectangular pattern.
Technical Overview:
- The 9-day and 50-day EMAs are currently aligned, signaling a market equilibrium where short-term and medium-term trends are converging.
- The 9-day EMA, which was previously below, is now attempting to cross above the 50-day EMA—a move that could indicate a potential bullish shift.
- The 14-day RSI remains above 50, reinforcing a bullish bias in the market.
Key Levels to Watch:
Upside Potential:
- The upper trendline of the rectangle at 0.5760 serves as the first resistance.
- A break above this level could push the pair toward the three-month high of 0.5794 (January 24).
- Further gains may lead NZD/USD to test the four-month high of 0.5922, recorded in December 2024.
Downside Risks:
- Immediate support is found at the 50-day EMA (0.5697) and the 9-day EMA (0.5696).
- A break below these levels could weaken short-term momentum, sending the pair toward the psychological level of 0.5600.
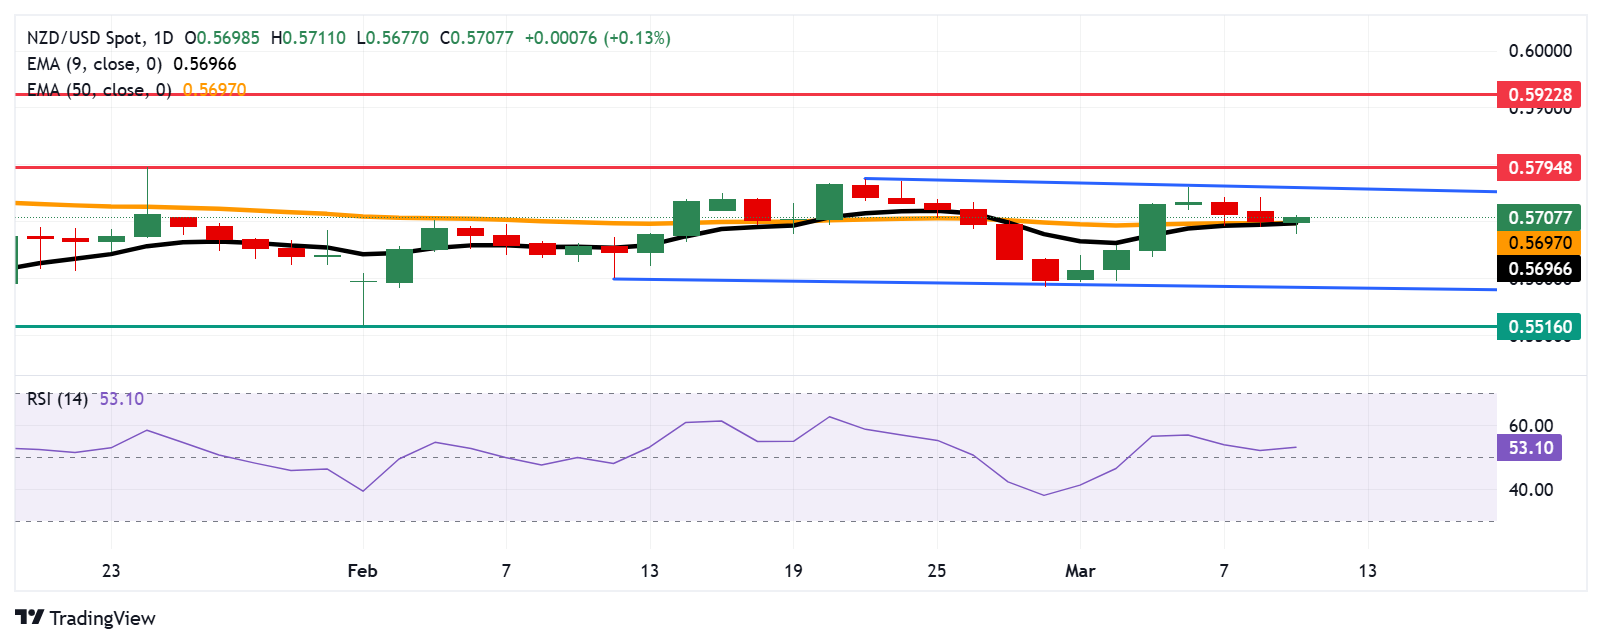
- Further declines may test the lower trendline of the rectangle at 0.5590, with additional support at 0.5516—its lowest level since October 2022, recorded on February 3.
The NZD/USD daily chart suggests that the pair remains in a consolidation phase, with a breakout in either direction likely to define the next trend.
NZD/USD: Daily Chart