- NZD/USD declines towards support at the 0.5850 level, within the descending channel pattern.
- Daily chart analysis shows a strengthening bearish bias as the pair continues to move lower within the descending channel.
- Immediate resistance is at the nine-day EMA, currently at 0.5907, with the next key resistance level at the 14-day EMA at 0.5926.
The NZD/USD pair breaks its three-day winning streak and is trading around 0.5890 during the European session on Wednesday. A closer look at the daily chart reveals a strengthening bearish bias as the pair moves lower within the descending channel pattern.
The nine-day Exponential Moving Average (EMA) remains below the 14-day EMA, indicating ongoing weakness in the short-term momentum. Additionally, the 14-day Relative Strength Index (RSI) remains below the 50 level, confirming the prevailing bearish sentiment.
On the downside, support is seen around the psychological 0.5850 level, with further support at the lower boundary of the descending channel near 0.5830. A decisive break below this channel would deepen the bearish outlook, potentially pushing the NZD/USD pair toward its two-year low of 0.5772, last recorded in November 2023.
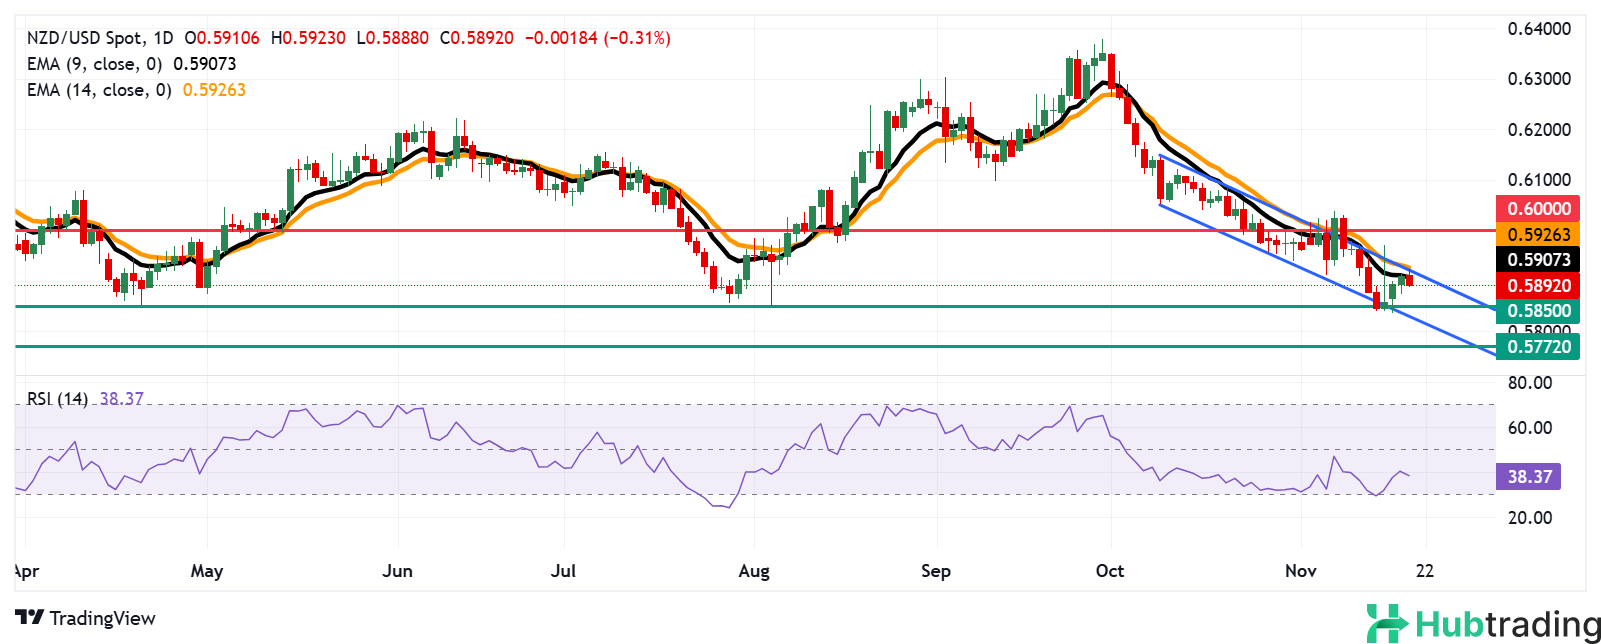
On the upside, immediate resistance is located at the nine-day EMA at 0.5907, followed by the 14-day EMA at 0.5926, which aligns with the upper boundary of the descending channel. A breakout above this level would reduce the bearish pressure and could open the door for the NZD/USD pair to target the psychological 0.6000 level.
NZD/USD: Daily Chart Analysis