- NZD/USD could approach the upper boundary of the descending channel pattern.
- A decline in the 14-day RSI below the 30 level would signal an oversold condition, possibly hinting at an upcoming upward correction.
- The pair may target the descending channel’s lower boundary near the 0.5920 level.
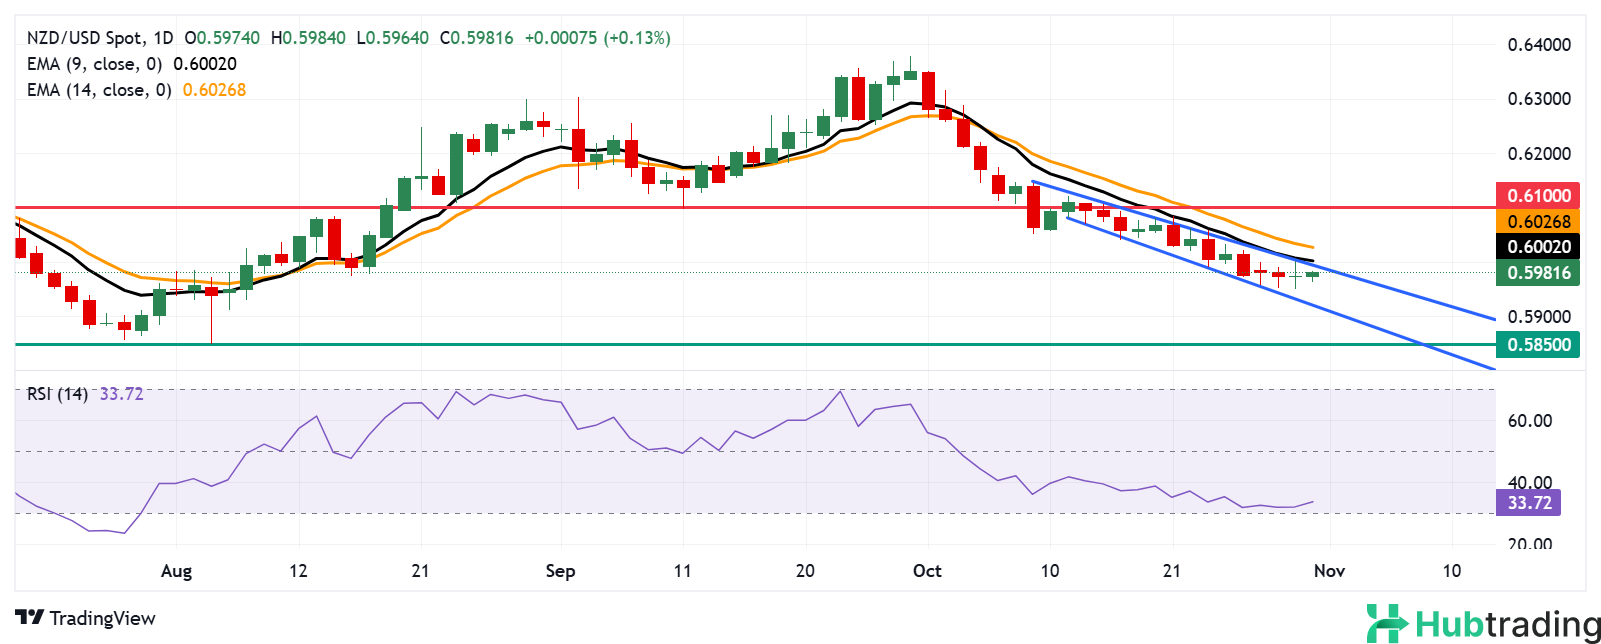
The NZD/USD pair advances for a second consecutive session, trading near 0.5980 in Thursday’s European session. The daily chart analysis reveals a continued bearish trend, with the pair moving within a descending channel. A breakout above this channel could indicate a potential momentum shift.
Reinforcing this bearish sentiment, the nine-day Exponential Moving Average (EMA) remains below the 14-day EMA. Short-term momentum appears weak, signaling sustained downward pressure for NZD/USD.
The 14-day Relative Strength Index (RSI), a key momentum indicator, currently hovers slightly above 30. A dip below this level would suggest an oversold condition, potentially signaling an impending upward correction.
On the downside, NZD/USD may test the descending channel’s lower boundary near 0.5920. A clear break below this level could open the door for further decline toward the next support at 0.5850.
On the upside, the initial resistance lies at the descending channel’s upper boundary, aligning with the nine-day EMA around 0.6001, followed by the 14-day EMA at 0.6026. A sustained move above these levels could shift the pair into a short-term bullish stance, potentially targeting the psychological resistance at 0.6100.
NZD/USD: Daily Chart