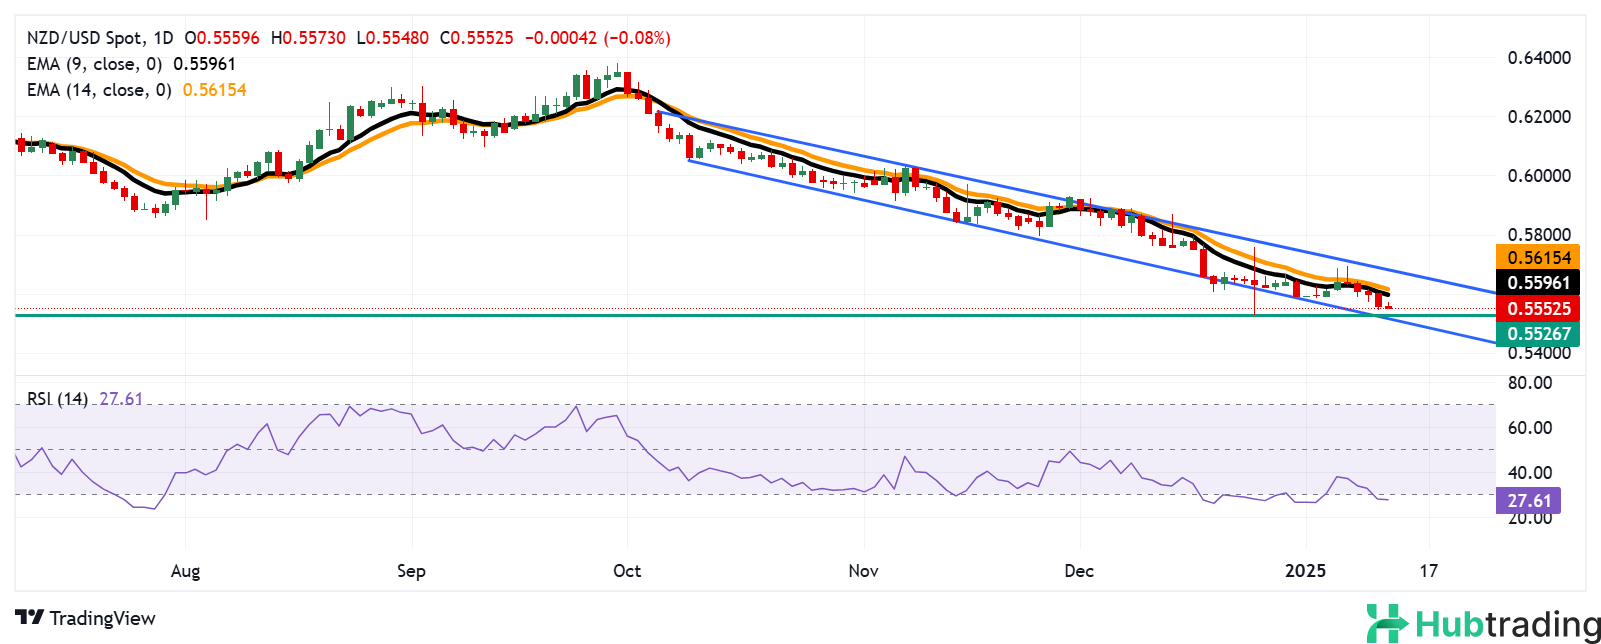
The NZD/USD pair extends its losing streak from January 7, hovering around 0.5550 during Monday's European session. Technical analysis of the daily chart highlights a sustained bearish bias as the pair trades near the lower boundary of a descending channel.
The 14-day Relative Strength Index (RSI) remains below the 30 threshold, indicating oversold conditions that may trigger a corrective rebound. However, if the RSI stays near this level, it could reinforce bearish momentum.
The pair also trades below the 14-day and nine-day Exponential Moving Averages (EMAs), signaling weak short-term momentum and suggesting that downward pressure may persist.
On the downside, immediate support is seen near the descending channel's lower edge at 0.5540, followed by a critical level at 0.5526, the lowest since October 2022, recorded on December 25.
On the upside, initial resistance lies at the nine-day EMA at 0.5596, with the next hurdle at the 14-day EMA at 0.5615. A sustained break above these levels could enhance short-term momentum and pave the way for a test of the descending channel’s upper boundary near the psychological 0.5700 mark.
NZD/USD: Daily Chart