- NZD/USD challenges immediate resistance at the nine-day EMA of 0.5654.
- The neutral bias persists as the 14-day RSI hovers near the 50 level.
- A break below 0.5650 could drive the pair toward the rectangle’s lower boundary at 0.5550.
The NZD/USD pair remains under pressure after previous session losses, trading around 0.5650 during European hours on Wednesday. Technical analysis on the daily chart suggests market indecision, with neither buyers nor sellers establishing a clear long-term direction as the pair consolidates within a rectangular pattern.
The 14-day Relative Strength Index (RSI) hovers near the 50 level, indicating a neutral market stance with no strong bullish or bearish momentum. A decisive move in either direction could provide a clearer trend. Additionally, the pair continues to trade around the nine-day Exponential Moving Average (EMA), reflecting neutral short-term price momentum.
The NZD/USD pair is testing a critical support level at 0.5650. A break below this level could push the pair toward the rectangle’s lower boundary at 0.5550, with further downside support at 0.5516—its lowest level since October 2022, recorded on February 3.
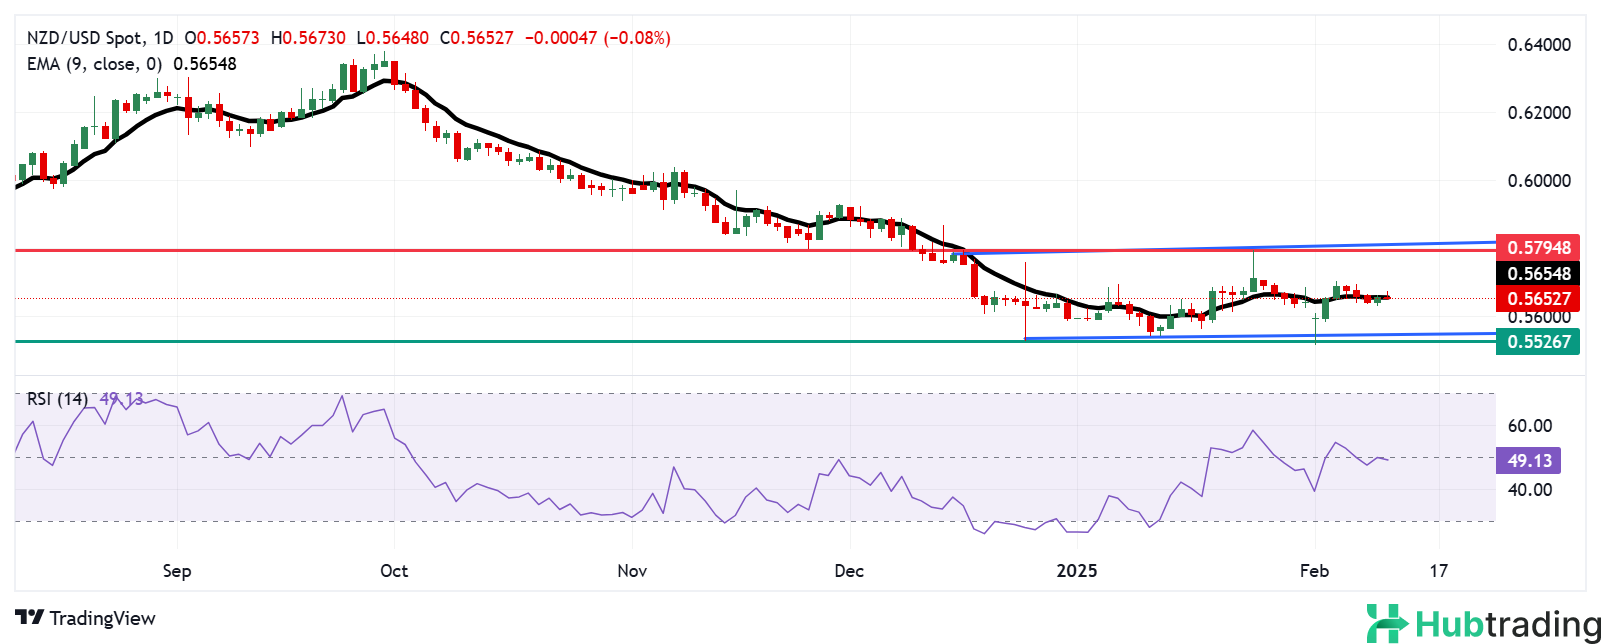
On the upside, NZD/USD is testing the nine-day EMA at 0.5654. A breakout above this level could strengthen short-term momentum, potentially driving the pair toward its nine-week high of 0.5794, reached on January 24. Further resistance levels lie at the psychological barrier of 0.5800 and the upper boundary of the rectangle at 0.5820.
NZD/USD daily chart