- Silver price recovers further to near $29.90 despite rising US bond yields, as Fed officials support fewer rate cuts in 2025.
- Soft monthly US PCE inflation data raises uncertainty over the Fed’s anticipated shallow rate-cut path.
- Silver price may face difficulty extending the upward trendline above $30.00 as market resistance grows.
Silver price (XAG/USD) extends Friday’s recovery, reaching near $29.90 during Monday’s European session. The rebound followed a strong move off a more than three-month low of $28.75 after the US Personal Consumption Expenditure Price Index (PCE) data for November showed price pressures rising at a slower pace than anticipated.
Core PCE inflation, the Federal Reserve’s (Fed) preferred inflation gauge, rose 2.8%, below the expected 2.9%. The month-on-month PCE inflation grew just 0.1%, increasing uncertainty around whether the Fed will continue with its projected shallow rate cuts in 2025, as outlined in the December policy meeting’s dot plot. The dot plot signals a Federal Funds rate of 3.9% by the end of 2025.
Silver prices continued their upward momentum on Monday despite higher US Treasury yields and Fed officials supporting fewer rate cuts in the coming year. The 10-year US Treasury yield rose to near 4.54%, exerting downward pressure on non-yielding assets like silver, as higher yields increase opportunity costs. The US Dollar Index (DXY) also edged higher to near 108.00.
On Friday, several Fed officials expressed support for a cautious policy easing approach, citing a slowdown in disinflation, improved labor market conditions, and uncertainty surrounding President-elect Donald Trump’s policies.
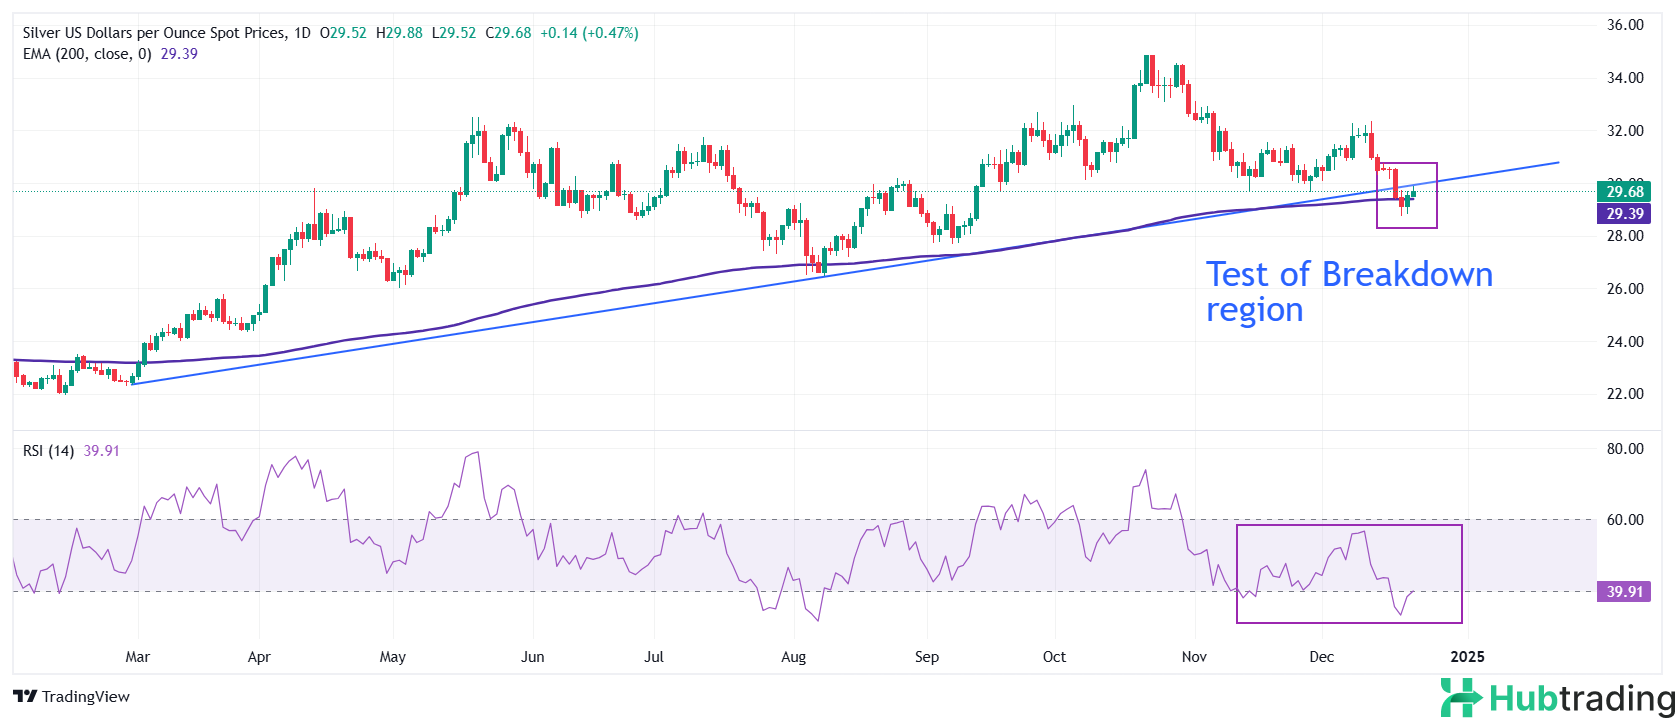
Silver Technical Analysis:
Silver prices are testing the breakdown of the upward-sloping trendline near $30.00, drawn from the February 29 low of $22.30. The metal hovers around the 200-day Exponential Moving Average (EMA), signaling uncertainty in the longer-term outlook.
The 14-day Relative Strength Index (RSI) has bounced to near 40.00, with fresh bearish momentum possible if it fails to break above this level.
On the downside, key support is at the September low of $27.75, while resistance lies at the 50-day EMA around $30.90.
Sliver daily chart