- Silver price drops to around $29.50 due to strong US Treasury yields.
- US bond yields hover near a six-month high as the Fed signals fewer rate cuts in 2025.
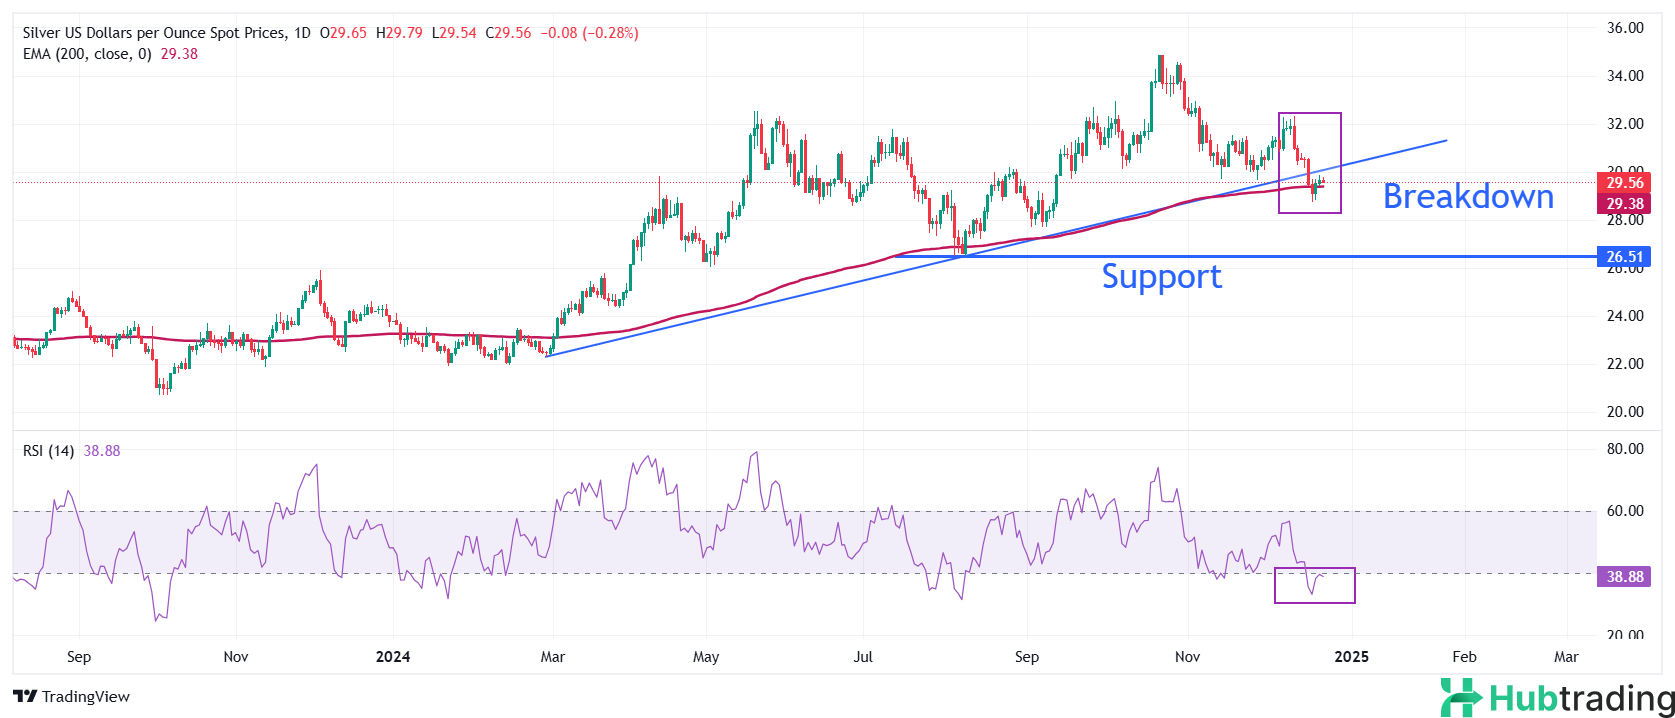
- Silver price continues to show weakness following the breakdown of the upward-sloping trendline.
Silver price (XAG/USD) dips to approximately $29.30 during Tuesday’s European session, maintaining a position within Monday’s trading range due to thin trading volumes ahead of the upcoming holidays for Christmas Eve and Thanksgiving Day. The white metal remains under pressure as the Federal Reserve (Fed) adopts a moderately hawkish stance on its monetary policy outlook.
The Fed has shifted from a “dovish” to a “cautionary” approach on interest rates, as the progress in disinflation has stalled in recent months, and labor market conditions are not as weak as initially expected in September. Additionally, policymakers anticipate that incoming immigration, tariff, and tax policies under US President-elect Donald Trump could have inflationary effects on the economy. The latest dot plot suggests two interest rate cuts in 2025, with analysts at UBS predicting these cuts to occur in June and September.
Meanwhile, the US Dollar Index (DXY), which tracks the Greenback against six major currencies, remains in a tight range above 108.00. Ten-year US Treasury yields hover near a six-month high of around 4.6%. Elevated yields on interest-bearing assets exert pressure on non-yielding assets like silver, as they increase the opportunity cost of holding the metal.
Silver Technical Analysis:
Silver remains below the upward-sloping trendline from the February 29 low of $22.30 on a daily timeframe, following a breakdown near $30.00. The price fluctuates around the 200-day Exponential Moving Average (EMA), indicating uncertainty in the long-term outlook.
The 14-day Relative Strength Index (RSI) has rebounded to near 40.00, and a fresh bearish momentum could trigger if the RSI fails to break above this level.
To the downside, the key support level for silver is the September low of $27.75. On the upside, the 50-day EMA near $30.90 acts as resistance.
Sliver daily chart