-
Silver faces immediate resistance at the key psychological level of $39.00.
-
The 14-day Relative Strength Index (RSI) remains above 50, supporting a bullish outlook.
-
Initial support is seen at the 9-day Exponential Moving Average (EMA) near $38.26.
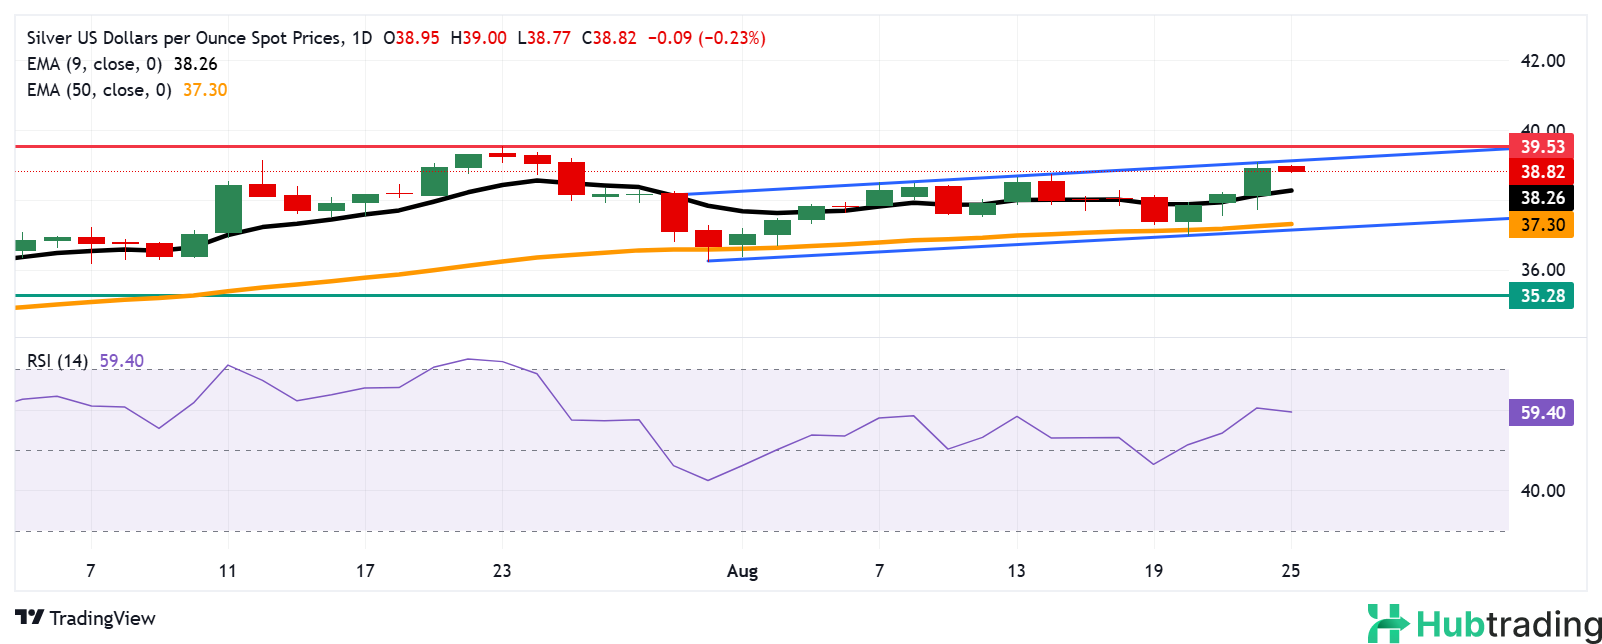
Silver (XAG/USD) dips slightly after a three-day winning streak, trading near $38.80 per troy ounce during Monday’s European session. Despite the minor pullback, the daily chart reveals the metal continues to trade within an ascending channel pattern, indicating a sustained bullish trend.
The 14-day Relative Strength Index (RSI) remains above the 50 mark, reinforcing the bullish momentum. In addition, Silver is holding above the nine-day Exponential Moving Average (EMA), suggesting strong short-term upward pressure.
On the upside, XAG/USD faces immediate resistance at the psychological level of $39.00, with further gains potentially targeting the upper boundary of the ascending channel near $39.17. A decisive break above this zone could confirm the bullish continuation, opening the door to a test of the July 23 high at $39.53 — the highest level since September 2011.
To the downside, initial support lies at the nine-day EMA of $38.26, followed by the 50-day EMA at $37.30 and the ascending channel’s lower boundary near $37.20. A breach of this confluence support area could undermine both short- and medium-term momentum, exposing the June 24 low at $35.28 — an 11-week trough.
XAG/USD: Daily Chart