- Equities tumble, bond prices soar, and gold hits a new all-time high as markets brace for Trump's reciprocal tariffs.
- On Sunday, President Trump confirmed that all countries will be affected
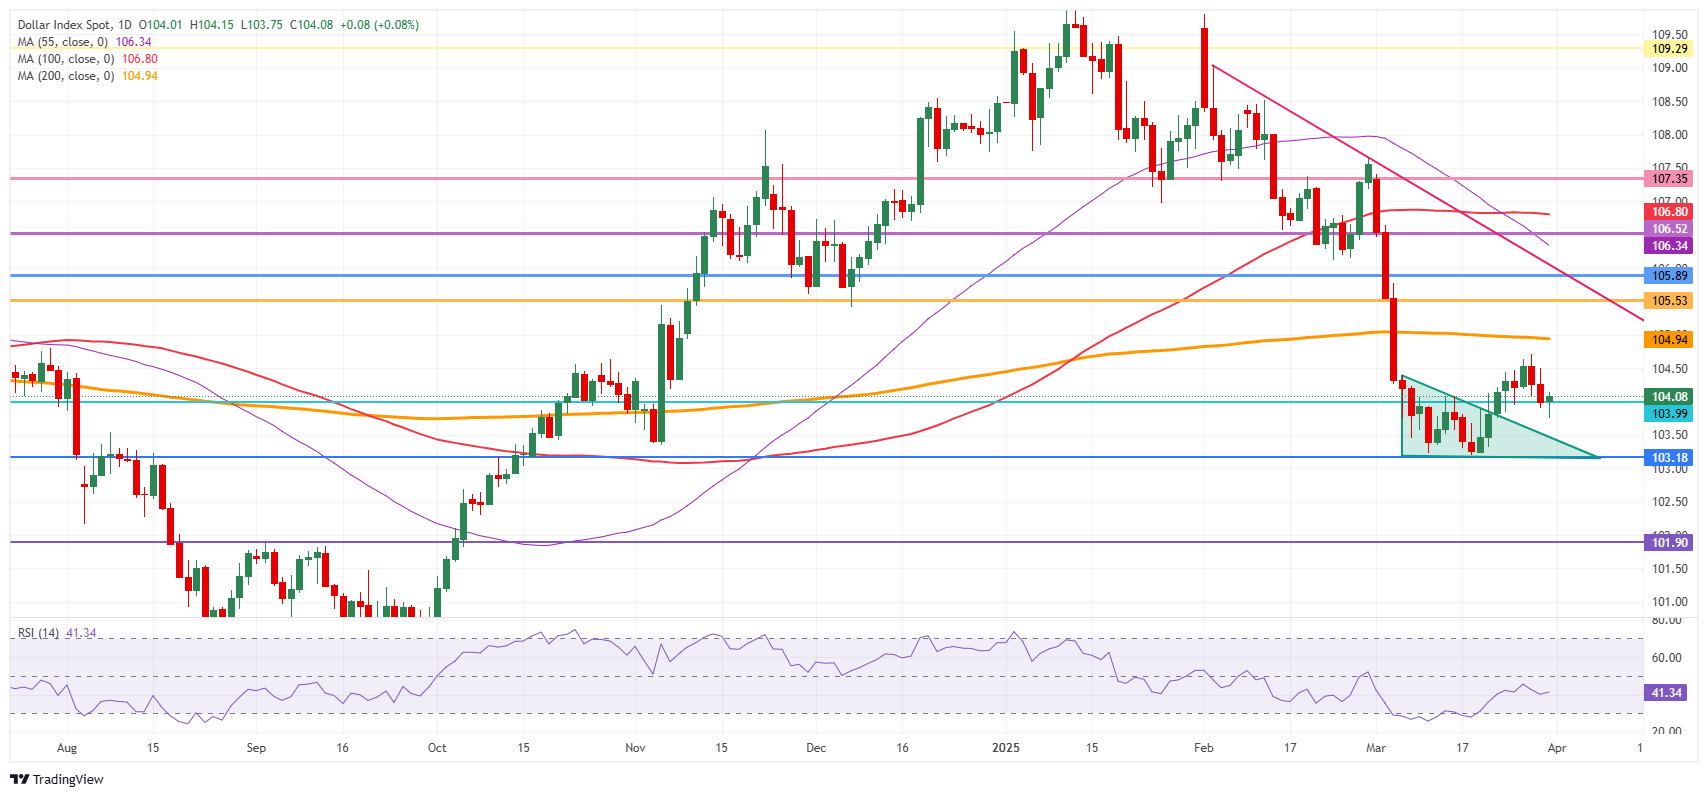
- The US Dollar Index remains steady around 104.10, seeing no safe-haven inflows.
The US Dollar Index (DXY), which measures the USD against six major currencies, remains flat on Monday as traders avoid placing bets on the Greenback. While equities plunge, bond prices soar, and gold reaches a fresh all-time high above $3,100, the DXY stays sidelined. This follows US President Donald Trump’s Sunday announcement aboard Air Force One that all countries will be subjected to reciprocal tariffs starting Wednesday, dubbed ‘Liberation Day,’ according to Bloomberg.
Last week highlighted the USD’s sensitivity to US economic data, with fears of stagflation and recession weighing on the currency. As a result, traders will closely watch Monday’s releases of the Chicago Purchasing Manager’s Index (PMI) and the Dallas Fed Manufacturing Business Index. Weak figures could drive the DXY lower.
Market Movers: Chicago PMI in Focus
-
The Chicago PMI will be released at 13:45 GMT, with expectations at 45.4, just below the previous 45.5.
-
The Dallas Fed Manufacturing Business Index follows at 14:30 GMT, with no forecast available after the previous reading of -8.3.
-
Global equities decline between 1.0% and 2.0%, extending losses from Asia to Europe and US futures.
-
The CME FedWatch Tool shows an 82.1% probability of the Fed maintaining rates at 4.25%-4.50% in May, while June rate-cut odds stand at 81.2%.
-
The US 10-year yield hovers around 4.20%, signaling increased expectations for a Fed rate cut in June.
Technical Analysis: DXY Loses Its Edge
The DXY has clarified one thing—tariffs have little direct impact on the USD, while economic data plays a key role. Friday’s weaker University of Michigan Consumer Sentiment data and elevated inflation expectations drove the Greenback lower. With recession fears no longer supporting a stronger USD, further stagflation signs could push the DXY down.
On the upside, a return to 105.00 remains possible, with the 200-day Simple Moving Average (SMA) at 104.94 acting as strong resistance. Beyond that, levels at 105.53 and 105.89 could cap further gains.
On the downside, 104.00 serves as the immediate support, though it appears weak after repeated tests on Friday and Monday. A drop below this level could see the DXY slide into the March trading range between 104.00 and 103.00. A break of 103.00 would expose further downside risk to 101.90.
US Dollar Index: Daily Chart