- US Dollar trades mixed and flat on Friday ahead of the Nonfarm Payrolls report.
- Markets anticipate weaker NFP data, which could fuel expectations for Fed rate cuts.
- The US Dollar Index (DXY) hovers near key support at 107.35, with a weaker NFP potentially pushing it lower.
The US Dollar Index (DXY), which tracks the greenback against six major currencies, trades at 107.83 ahead of the highly anticipated US Nonfarm Payrolls (NFP) report for January. Market consensus points to a significantly weaker print, reflecting recent US economic data suggesting a slowdown in job growth. A softer-than-expected report could increase expectations for more than two Federal Reserve (Fed) rate cuts in 2025.
The NFP report is expected to show 170,000 new jobs in January, down from December's 256,000. Estimates range between 105,000 and 240,000, with any print below 105,000 likely to trigger substantial USD weakness and push the DXY below 107.00.
Daily Market Movers: Key Data and Events
- US Nonfarm Payrolls (13:30 GMT)
- Expected: 170,000 (previous: 256,000)
- Average Hourly Earnings: Forecasted to remain at 0.3% monthly growth
- Unemployment Rate: Expected to hold steady at 4.1%
Fed Speeches
- Fed Governor Michelle Bowman speaks on bank regulation at 14:25 GMT.
- Fed Governor Adriana Kugler discusses “Entrepreneurship and Aggregate Productivity†at 17:00 GMT.
Market Sentiment
- European equities trade mixed, while US futures remain flat.
- The CME FedWatch Tool projects an 85.5% probability of the Fed holding rates unchanged at its March 19 meeting.
- The US 10-year Treasury yield hovers around 4.44%, rebounding from a yearly low of 4.40% seen on Wednesday.
US Dollar Index Technical Outlook: Key Levels to Watch
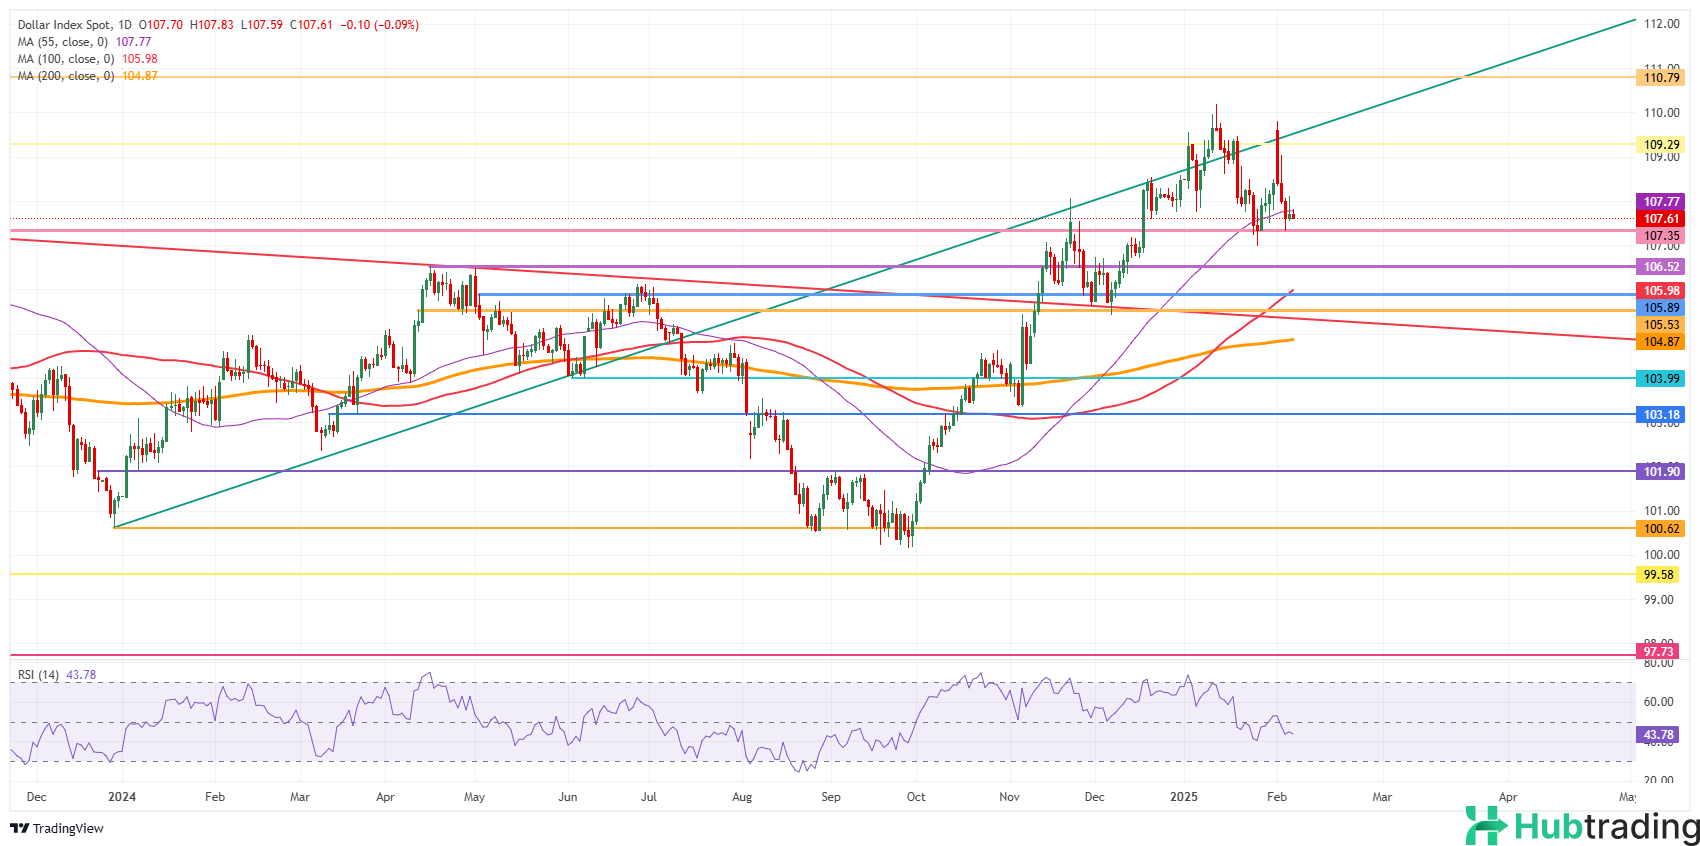
The DXY faces a crucial moment, with US yields declining and economic data opening the door for more than two Fed rate cuts this year. If the NFP print is significantly weaker, markets could start pricing in three rate cuts for 2025, potentially pushing the DXY down to 106.00.
Resistance Levels:
- 109.30 - July 14, 2022, high and rising trendline (briefly surpassed on Monday but failed to hold).
- 110.79 - September 7, 2022, high, the next key level to reclaim.
Support Levels:
- 107.35 - October 3, 2023, high, acting as immediate support.
- 106.52 - April 16, 2024, high, a stronger support zone.
- 105.98 - June 2024 resistance and 100-day Simple Moving Average, a critical level if selling pressure intensifies.
With the Relative Strength Index (RSI) cooling off over the past three days, there is now more downside potential for the DXY if data disappoints. The NFP report could be the catalyst for significant moves, with a weaker print likely fueling dollar losses and increased Fed rate cut bets.


