- The US Dollar Index declines to around 107.25 in early European trading on Monday.
- While the DXY maintains a positive outlook above the 100-day EMA, further consolidation remains a possibility.
- Immediate resistance is seen at 108.45, while initial support emerges at 106.70.
The US Dollar Index (DXY) retreats to around 107.25 during early European trading on Monday, snapping a three-day winning streak as expectations grow for two quarter-point Fed rate cuts by year-end.
From a technical perspective, the DXY maintains a bullish outlook while holding above the 100-day Exponential Moving Average (EMA) on the daily chart. However, the 14-day EMA hovers near the midline, signaling potential near-term consolidation.
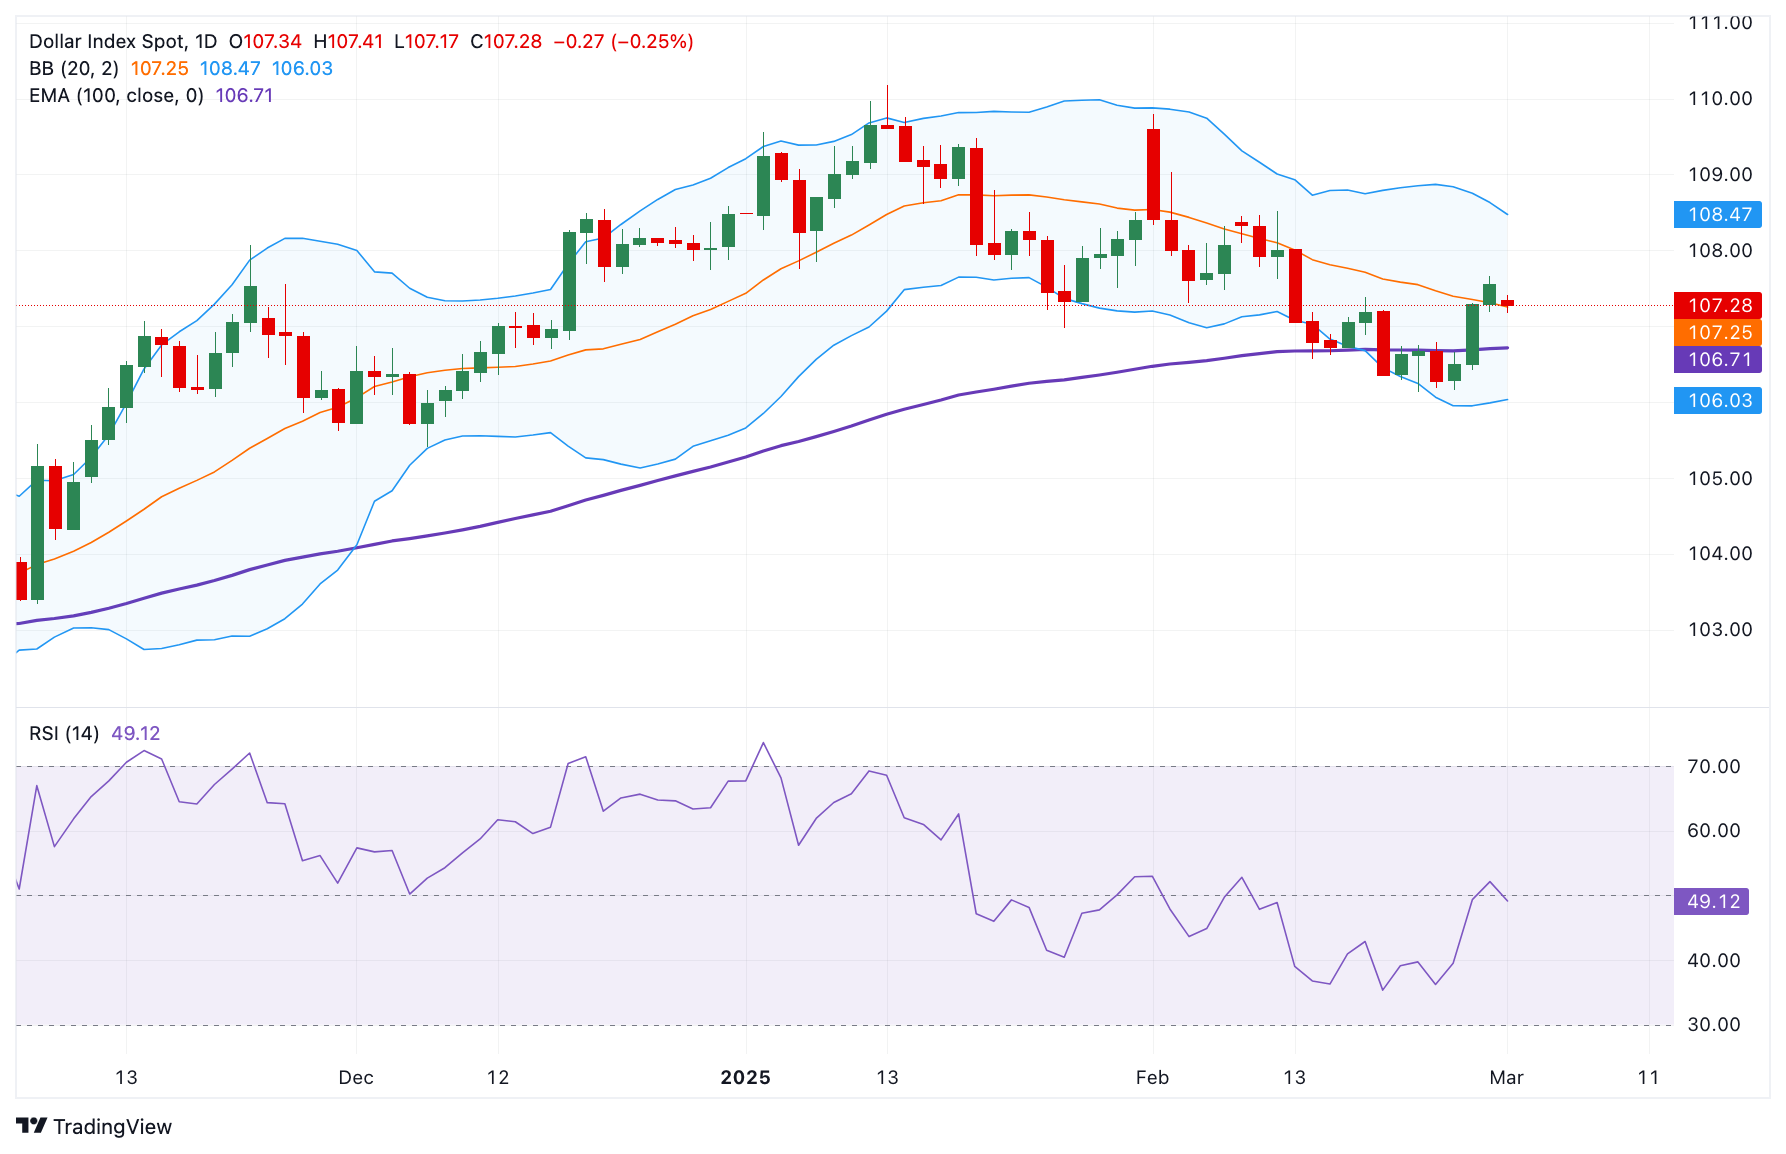
On the upside, immediate resistance is seen at 108.45, aligning with the February 10 high and the upper Bollinger Band boundary. A sustained move above this level could open the door to 109.80 (February 3 high), with the 110.00 psychological mark acting as an additional hurdle.
On the downside, initial support lies at the 100-day EMA of 106.70. A decisive break below this level may expose the key support at 106.00, which coincides with the lower Bollinger Band boundary. Further weakness could push the index toward 105.41, the December 6, 2024 low.
The US Dollar Index (DXY) daily chart