- The US Dollar stabilizes after Thursday's losses.
- Market uncertainty rises over potential new tariff actions from President Trump.
- The US Dollar Index (DXY) falls below 108.00 and remains near 107.00.
The US Dollar Index (DXY), which measures the value of the US Dollar (USD) against six major currencies, is hovering around 107.00, consolidating Thursday’s losses. The Greenback weakened again after US President Donald Trump signed a memo on Thursday instructing his staff to work on reciprocal tariffs. These tariffs are expected to take weeks or even months to be implemented, giving US trading partners time to negotiate and seek resolutions.
The focus this week is on US Retail Sales data, set to be released on Friday. Although US economic data usually impacts markets, this week's figures seem to have been largely overlooked. Investors will shift their attention next week to the S&P Global PMI data for February, due on February 21.
Daily Market Movers: US Retail Sales Data Ahead
At 13:30, several important data points will be released:
- January Import/Export prices: The Export Price Index is expected to rise by 0.3%, while the Import Price Index is forecast to increase by 0.4% compared to December’s 0.1%.
- January Retail Sales: A decline of 0.1% is expected, following a 0.4% growth in December. Retail Sales excluding cars and transportation are anticipated to drop to 0.3% from 0.4% the previous month.
- Equities are showing mixed performance, with most indices seeing little movement—up or down by less than 0.5%.
The CME FedWatch tool suggests a 57.4% chance that the Federal Reserve will keep interest rates unchanged until June, indicating the Fed's intention to maintain its current rate stance in the face of persistent inflation.
The US 10-year yield is trading around 4.54%, a drop from this week’s high of 4.657%.
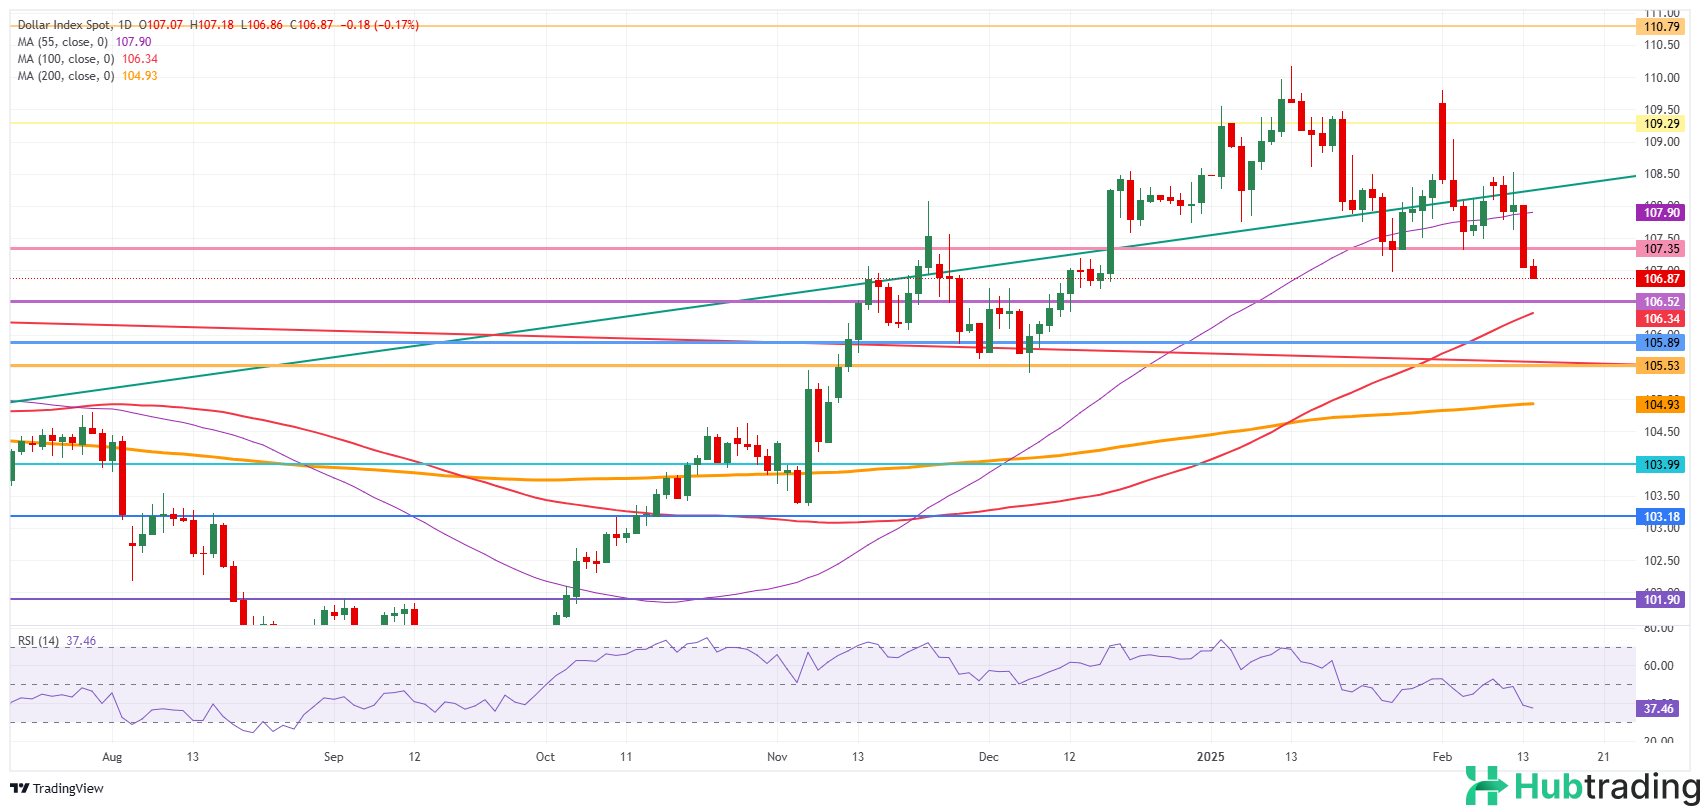
US Dollar Index Technical Analysis: Weakness Continues
The DXY is set to finish the week with a clear loss, with strong resistance now at 107.35. Technically, the index appears to be under pressure, with the moving averages and the Relative Strength Index (RSI) pointing toward further downside potential. The 200-day Simple Moving Average (SMA) around 104.93 is a key level to watch.
On the upside, the previous support at 107.35 has turned into a significant resistance level. To test the 108.00 level, the DXY would need to reclaim the 55-day SMA at 107.90.
On the downside, support levels to monitor include 106.52 (from April 16, 2024), 106.34 (100-day SMA), and 105.89 (resistance in June 2024). Despite room for further downside according to the RSI, the 200-day SMA at 104.93 could be a potential target.