- The USD/CAD pair is likely to approach the ascending channel’s upper boundary around the 1.4080 level.
- A potential downward correction could occur if the 14-day RSI rises above 70.
- Immediate support is seen at the nine-day EMA at 1.3943, followed by the 14-day EMA at 1.3917.
The USD/CAD pair extends its gains for a fifth consecutive day, trading around 1.4010 during the Asian session on Thursday. On the daily chart, the pair is moving within an ascending channel, indicating a sustained bullish trend.
The 14-day Relative Strength Index (RSI), a common tool for identifying overbought or oversold conditions, is just below the 70 level. This reflects ongoing bullish momentum without yet signaling an overbought condition. If the RSI crosses above 70, traders may anticipate a potential pullback, which could bring the pair back toward the 1.4000-1.3950 range.
On the upside, the USD/CAD pair may test resistance near the ascending channel’s upper boundary at around 1.4080. A breakout above this level could further reinforce the bullish trend, with the next key resistance at 1.4173—the high reached in May 2020.
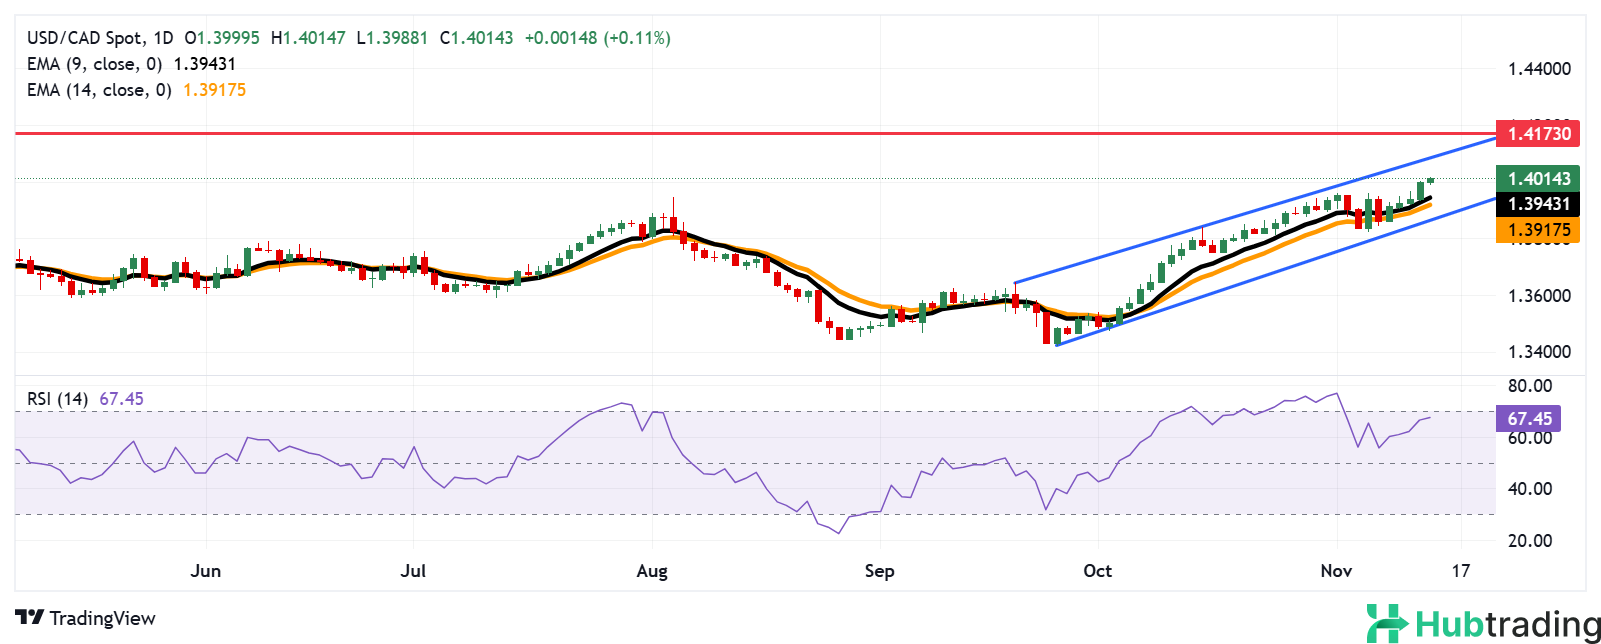
For support, the pair may encounter immediate levels around the nine-day Exponential Moving Average (EMA) at 1.3943, followed by the 14-day EMA at 1.3917. A drop below these EMAs could weaken the bullish momentum, potentially leading to a test of the channel’s lower boundary at the 1.3860 level.
USD/CAD: Daily chart