-
USD/CAD eyes a move toward the rectangle’s upper boundary near 1.3770.
-
Bullish bias persists with the 14-day RSI holding above the 50 mark.
-
Immediate support is seen at the 50-day EMA, currently around 1.3728.
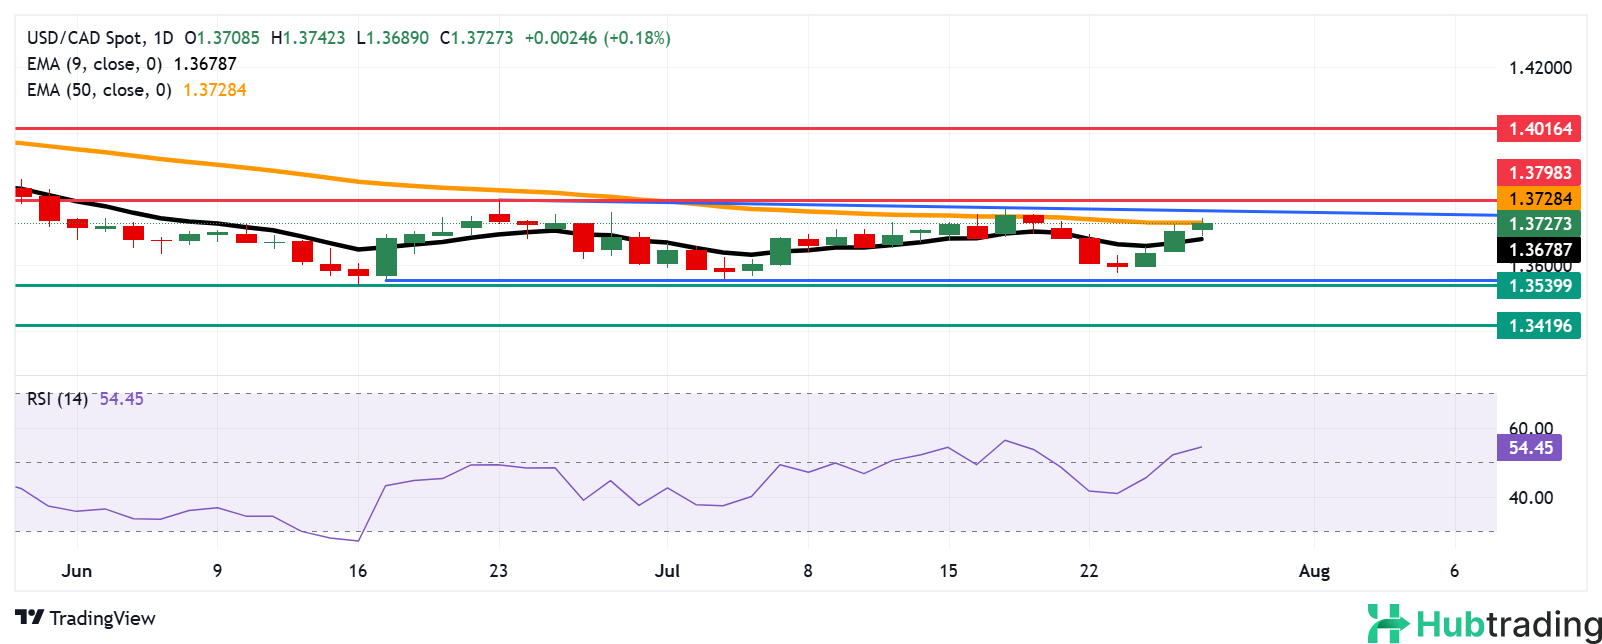
USD/CAD extends its winning streak into a third consecutive session, trading near 1.3730 during Monday’s European hours. On the daily chart, the pair continues to consolidate within a well-defined rectangular range, reflecting a neutral broader trend.
That said, momentum indicators lean bullish. The 14-day Relative Strength Index (RSI) remains above the 50 level, and the pair holds above the nine-day Exponential Moving Average (EMA), signaling ongoing short-term strength.
Upside targets include the rectangle’s upper boundary around 1.3770, followed by the June 23 high at 1.3798. A sustained break above this level could open the door for a test of the May 13 peak at 1.4016, the highest level in three months.
On the downside, immediate support lies at the 50-day EMA at 1.3728, followed by the nine-day EMA at 1.3679. A break below these levels would weaken the bullish structure and expose the lower boundary of the rectangle near 1.3560, closely aligned with the nine-month low of 1.3539. Further declines could lead to a retest of the February 2024 low at 1.3419.
USD/CAD: Daily Chart