- USD/CHF is exhibiting growing signs that a trend reversal may be imminent.
- The pair has established a bearish Two-Bar reversal pattern and has breached the uptrend's trendline on three occasions.
USD/CHF appears to be reversing the uptrend observed over the past five weeks, with mounting technical evidence suggesting the pair may be entering a new short-term downtrend.
USD/CHF Daily Chart
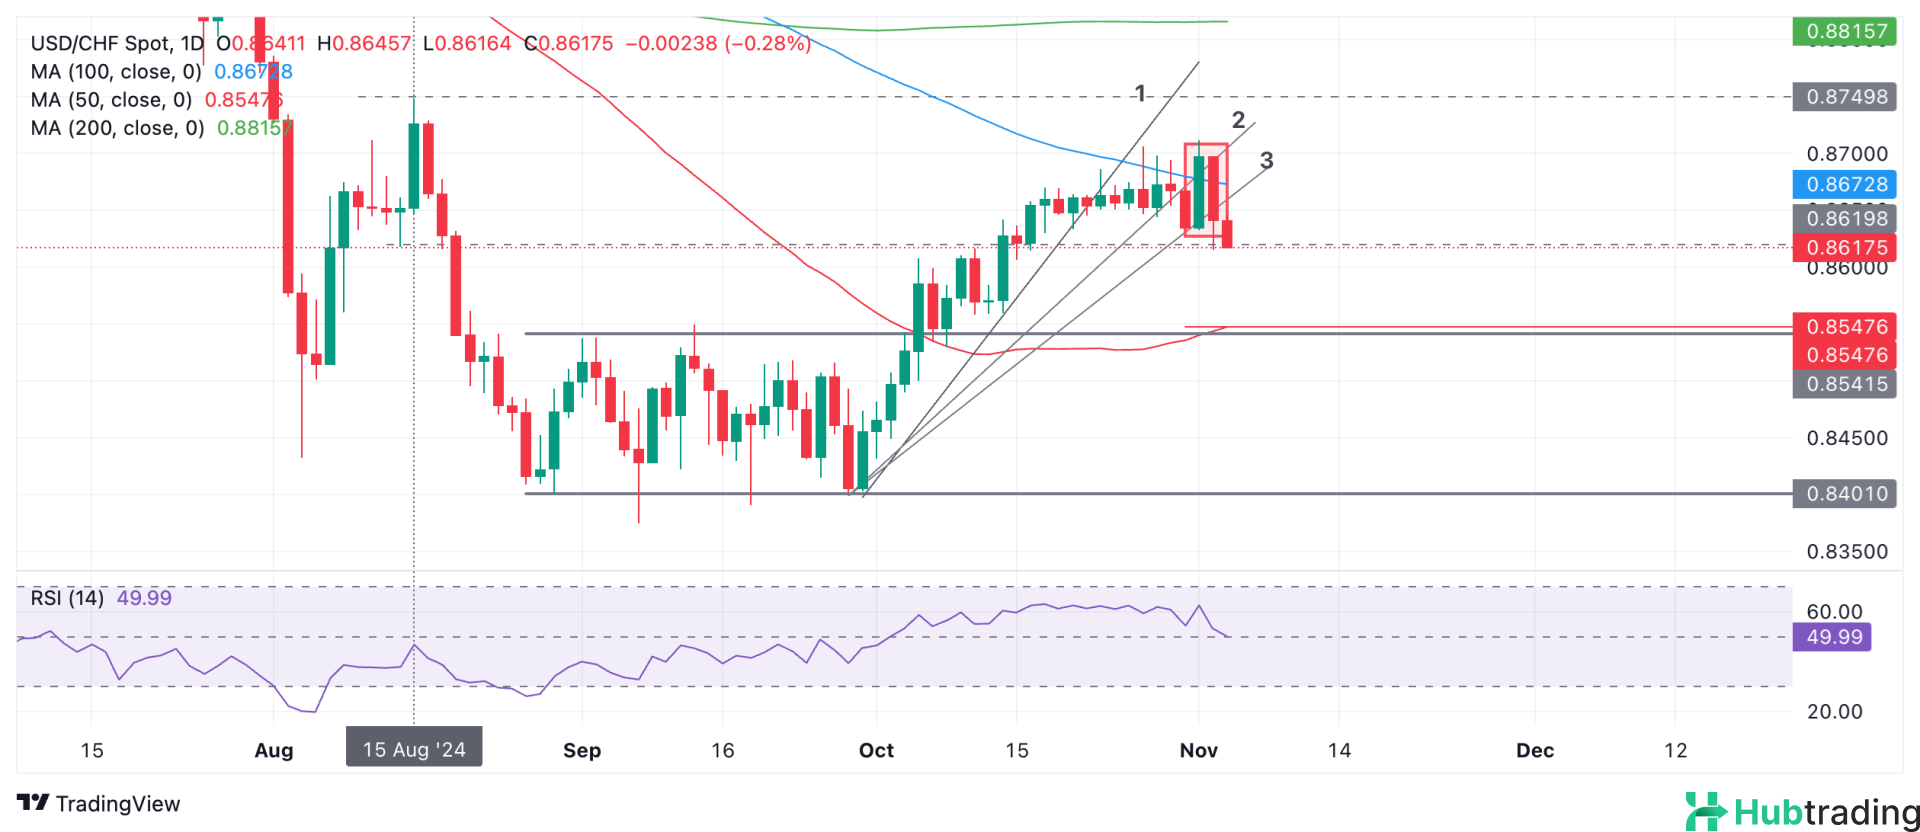
On the daily chart, USD/CHF has formed a bearish Two-Bar reversal pattern, identified by a red-bordered rectangle. This pattern emerged on Monday and Friday, characterized by a longer-than-average bullish green candle followed by a similarly shaped bearish red candle. This formation typically indicates a shift in sentiment and often signifies near-term weakness, often leading to a trend reversal.
Additionally, the trendline supporting the October rally has been broken and redrawn three times, further reinforcing the potential for a reversal, according to technical analysis principles.
USD/CHF 4-hour Chart
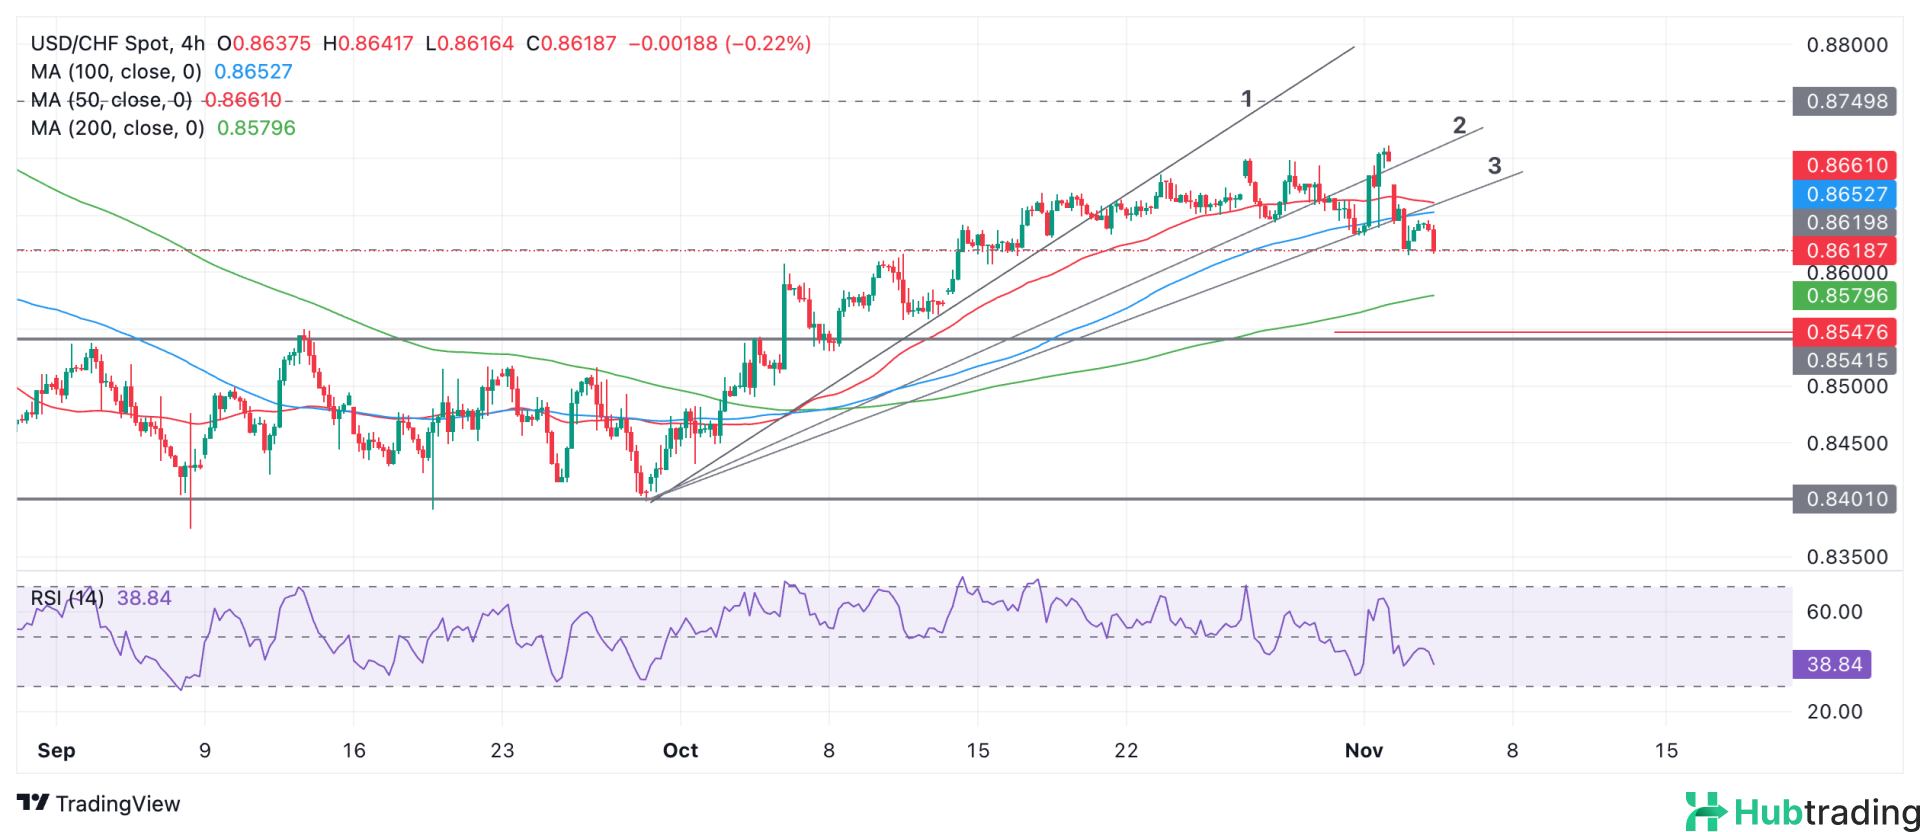
In the 4-hour chart, a break below the November 4 low of 0.8615 would confirm the likelihood of further downside and the establishment of a downtrending bias. Such a move could lead to a target around 0.8550, where the 50-day Simple Moving Average is situated.


